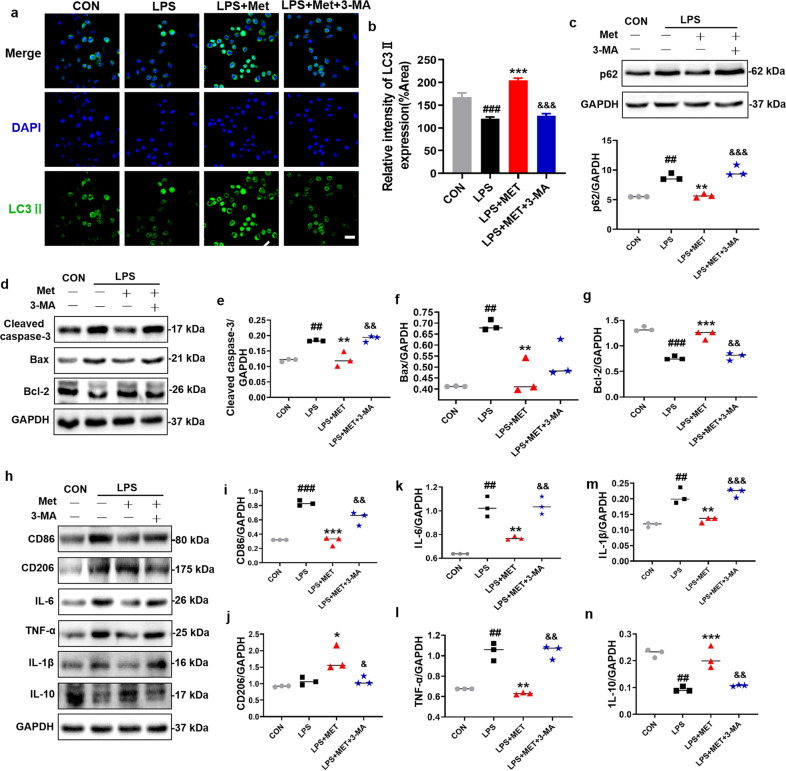
Fig. 8. 3-MA treatment reverses the protective effect of metformin on BV2 cells.
a, b Immunofluorescence staining of LC3II (green) in BV2 cells, and quantification of the number of LC3II in selected area after treating metformin with or without 3-MA (n = 5). Scale bar = 50 μm. c Western blotting and quantification analysis of p62 in BV2 cells after treating metformin with or without 3-MA (n = 3). d–n Western blotting and quantification analysis of Cleaved-caspase 3, Bax, Bcl-2, IL-1β, IL-6, IL-10, TNF-α, CD206, and CD86 in BV2 cells after metformin treatment with or without 3-MA (n = 3). ##P < 0.01, ###P < 0.001 vs. CON group; *P < 0.05, **P < 0.01, ***P < 0.001 vs. LPS group; &P < 0.05, &&P < 0.01, &&&P < 0.001 vs. LPS + Met group. LPS lipopolysaccharide, Met metformin, 3-MA 3-Methyladenine.

