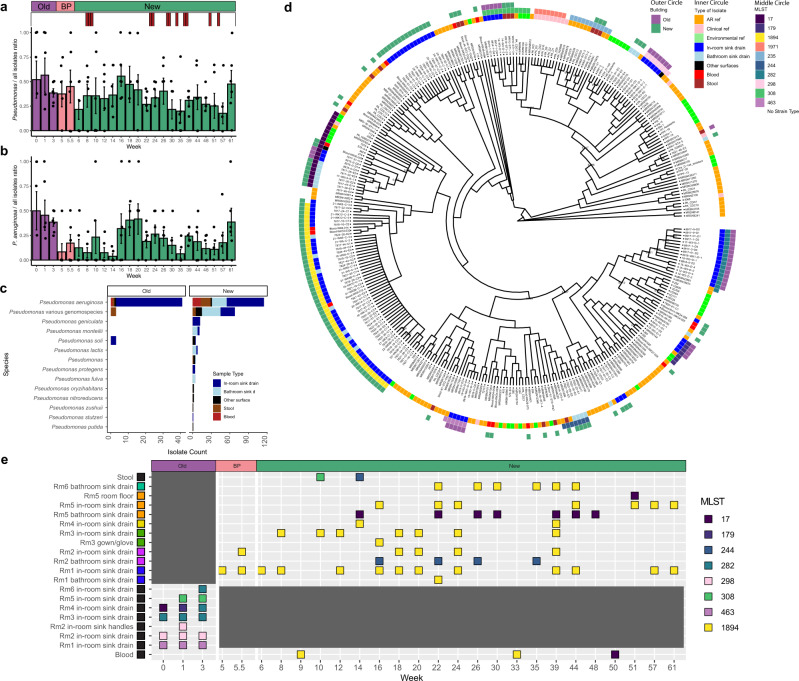
Fig. 4. Timing, identity, and phylogenetics of Pseudomonas spp. isolates.
a Ratio of Pseudomonas spp. to all isolates across all time points (n = 283 Pseudomonas isolates). Error bars indicate standard error. Red bars indicate collection timing of Pseudomonas aeruginosa blood culture isolates. b Ratio of P. aeruginosa to all isolates across all time points (n = 155 P. aeruginosa isolates). Error bars indicate standard error. c Identity of all collected Pseudomonas spp. genomes by >95% ANI to reference genome by sample collection type. Other indicates all other surface/water genomes apart from in-room and bathroom sink drain. All genomes were identified as Pseudomonas spp. by MASH. Pseudomonas various genomospecies includes all different genomospecies that did not share >95% ANI with a reference genome. d Cladogram from a core genome alignment of P. aeruginosa genomes. Branches with less than 80% bootstrap support are collapsed. Branches with bootstrap values between 80–95% are labeled. Reference P. aeruginosa genomes included antibiotic-resistant (AR) isolates, clinical isolates, and environmental isolates. Reference MLST is included if it shares a MLST with collected isolates. e Time point mapping of top 8 MLST P. aeruginosa groups by sample collection location. BP before patient and staff move-in.

