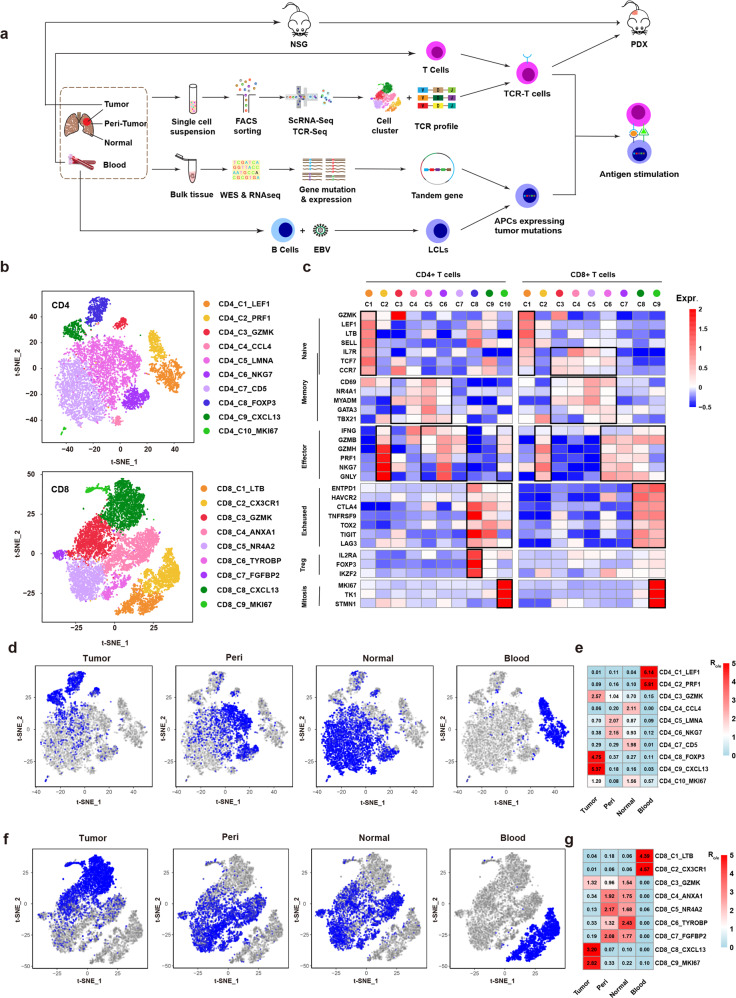
Fig. 1. ScRNA-seq identified tumor-enriched T cell clusters.
a Scheme of overall study design. b t-SNE projection of the expanded CD4+ and CD8+ T cells. Cells are color-coded for clusters. c Mean expression of genes associated with T cell subtypes in each cluster. d Cells from tumor, peri-tumor, normal and blood tissues (left to right panels) are highlighted with blue color in the t-SNE plot of the expanded CD4+ T cells, respectively. e Tissue prevalence estimated by Ro/e score in expanded CD4+ T cells. f Cells from tumor, peri-tumor, normal and blood tissues (left to right panels) are highlighted with blue color in the t-SNE plot of the expanded CD8+ T cells, respectively. g Tissue prevalence estimated by Ro/e score in expanded CD8+ T cells.

