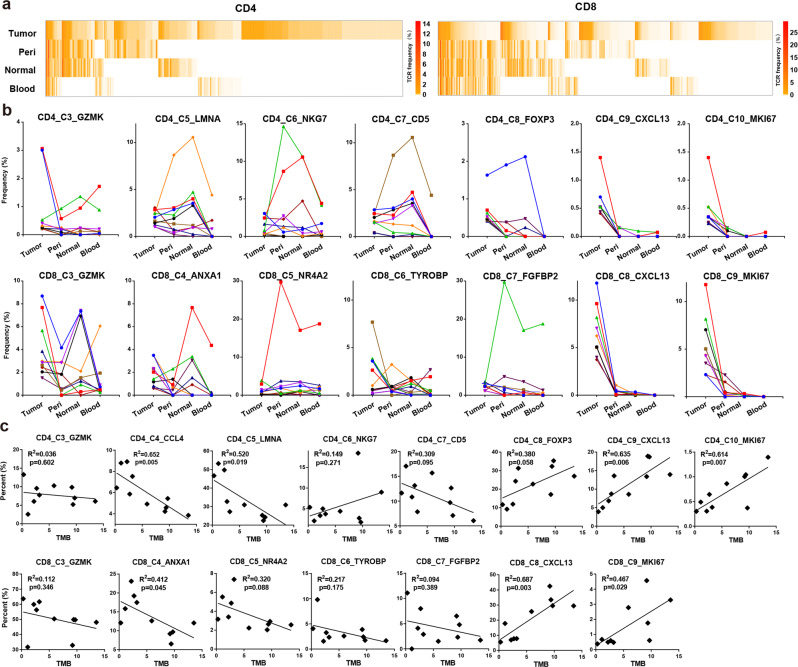
Fig. 2. Tumor-enriched T cells were expanded by tumor antigens.
a Heatmap showing the frequency of each TCR in the four tissues. The top 200 TCRs in expanded CD4+ and CD8+ T cells from tumor were presented. Columns represent different clonotypes, and rows represent different tissues. Color key represents the frequency of each TCR in every tissue. b Line chart showing the frequency of each TCR in the four tissues. The top 10 TCRs of expanded tumor CD4+ (top) and CD8+ (bottom) T cells in each cluster were presented. Each line represents a TCR. c Scatter plot showing the correlation between TMB and the percent of tumor CD4+ (top) of CD8+ (bottom) T cell from each cluster in the total tumor CD4+ or CD8+ T cells in 10 patients, respectively.

