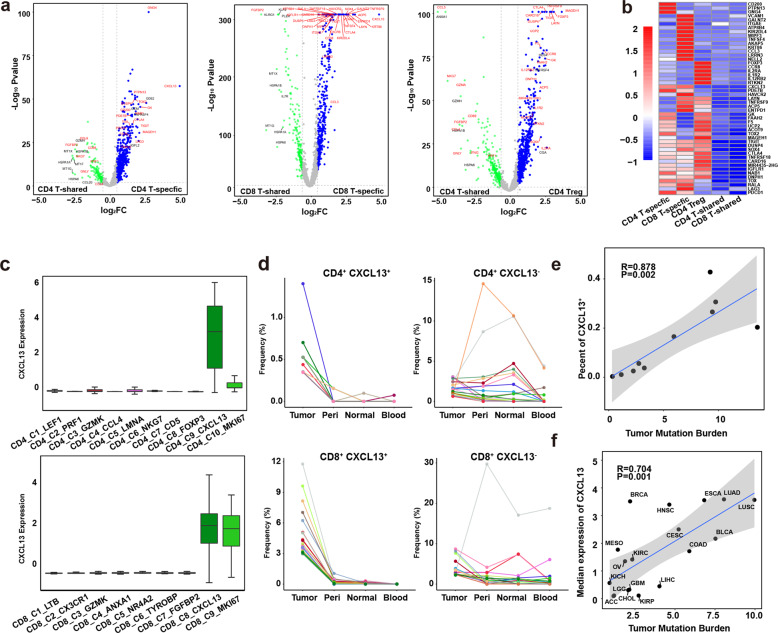
Fig. 3. Identification of specific markers for Tas cells.
a Volcano plots showing differentially expressed genes between CD4+ T-shared and T-specific cells, CD8+ T-shared and T-specific cells, and CD4+ T-shared cells and CD4+ Treg cells. Blue dots represent significantly upregulated genes in CD4+ T-specific, CD8+ T-specific and CD4+ Treg cells respectively (|log2(FC)| > 0.58, P < 0.05). b Heatmap showing the expression of selected genes in CD4+ T-specific, CD8+ T-specific and CD4+ Treg cells, CD4+ T-shared and CD8+ T-shared cells (right panel); c Box plot showing the expression of CXCL13 in CD4+ (top panel) and CD8+ T cell clusters (bottom panel). d Line chart showing the frequency of each TCR in the four tissues. The top 20 TCRs of CD4+CXCL13+, CD4+CXCL13−, CD8+CXCL13+, and CD8+CXCL13− T cells were presented. Each line represents a TCR. e The correlation between the percents of CXCL13+ T cells in tumor T cells and the TMB of each tumor. f The correlation between the median expression of CXCL13 and TMB of each cancer type.

