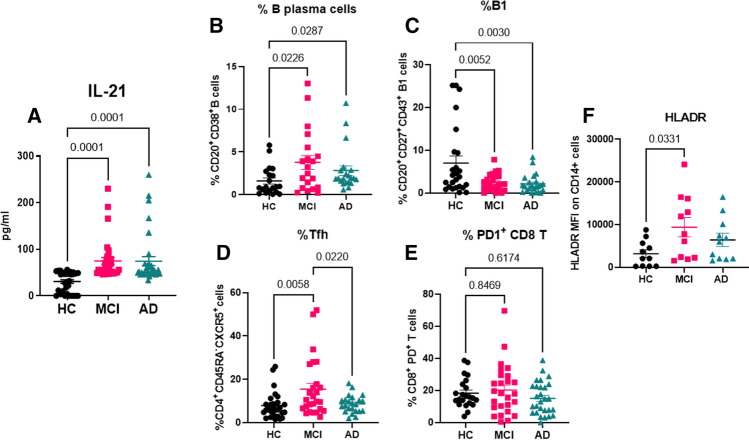
Fig. 1.
Comparison of the IL-21 plasma levels and percentages of B and T cells and activation of monocytes in AD, MCI and healthy controls. Plasma samples from AD, MCI and age-matched healthy controls (HC) were analyzed for IL-21 using specific ELISA. N = 34; M = 17; F = 17. A Dot plot depict the level of IL-21 in the three groups. PBMCs from AD, MCI and HC were subjected to flow cytometry and live gated cells were analyzed for the following—B B plasma cells (CD20+CD38+); C B1 cells (CD20+, CD27+, CD43+); D Tfh cells (CD4+CD45RA−CXCR5+); E exhausted CD8T cells (CD8+, PD1+); F activated monocytes (CD14+, HLADR+). N = 20; M = 10; F = 10. One way ANOVA followed by Tukey’s test was used for analysis

