
Fig. 2. Beta-amyloid levels in frontal cortex of low and high stage AD.
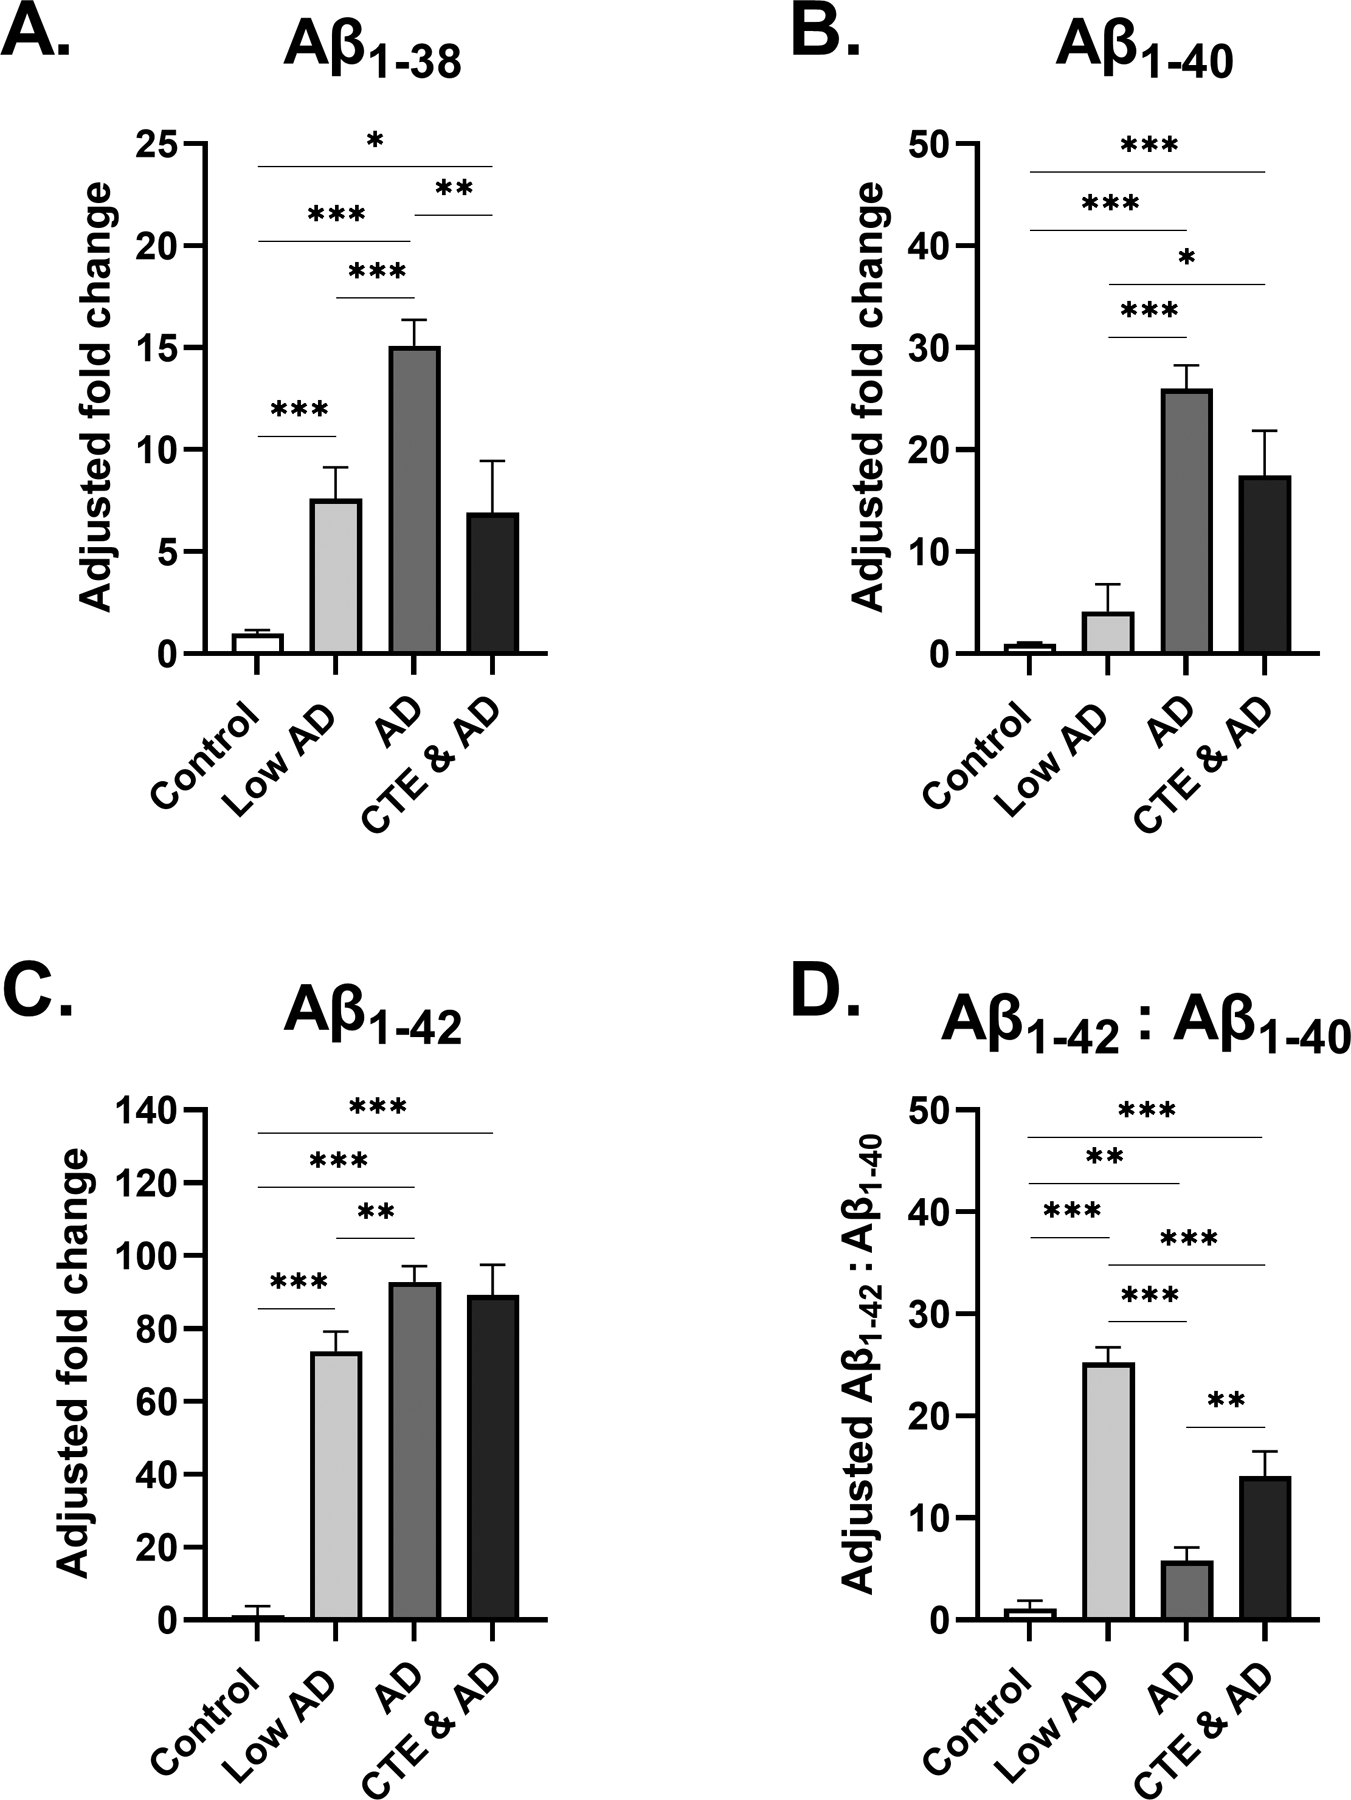
(A-C) Estimated marginal mean and SEM of fold change from control is displayed. (A) Participants with AD displayed significantly increased Aβ1–38 in comparison to control, Low AD, and CTE & AD groups. (B) In participants with AD, Aβ1–40 fold change to control was significantly increased from the control and Low AD group. (C) Aβ1–42 fold change to control was increased even further in participants with Low AD, AD, and CTE & AD, with Aβ1–42 displaying a 93-fold increase with respect to control. (D) Estimated marginal mean and SEM of Aβ1–42:Aβ1–40 ratio is displayed. Aβ1–42 was increased relative to Aβ1–40 in all three groups. However, the greatest increase in Aβ1–42:Aβ1–40 levels was observed in the Low AD group, which was highly significant from controls, AD, and CTE & AD groups. For (A-D) *p<0.05, **p<0.01, ***p<0.001, ANCOVA adjusting for age at death.