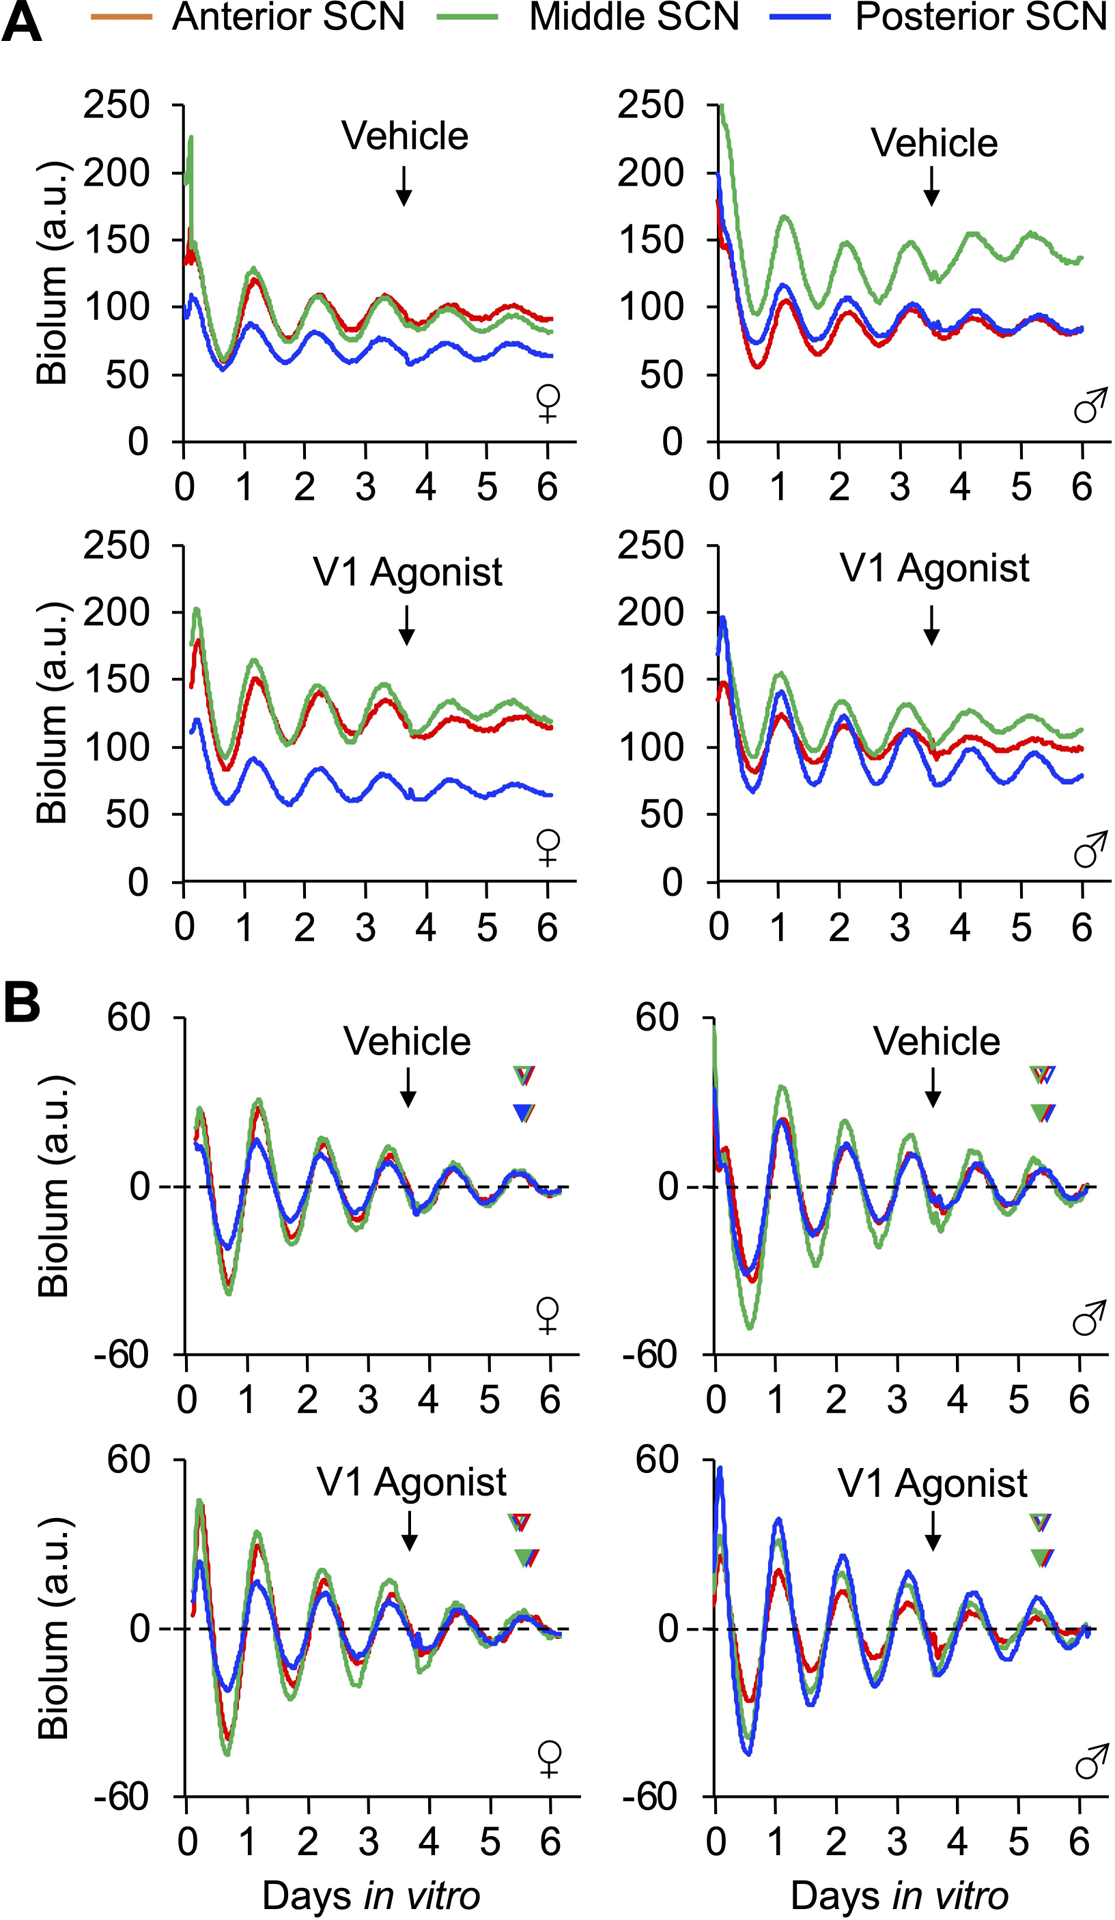
Figure 1. PER2∷LUC rhythms in vehicle- and 10μM V1A/B-treated slices collected from the anterior, middle, and posterior SCN of adult male and female mice.

A. Absolute PER2∷LUC levels in three slices collected from a mouse in each group. B Baseline-subtracted PER2∷LUC rhythms in the same three slices in A). Arrow represents time of treatment in vitro for each panel. In B, predicted and actual post-treatment peak times are indicated by open and filled arrowheads, respectively (color coded by slice).
