Figure 1.
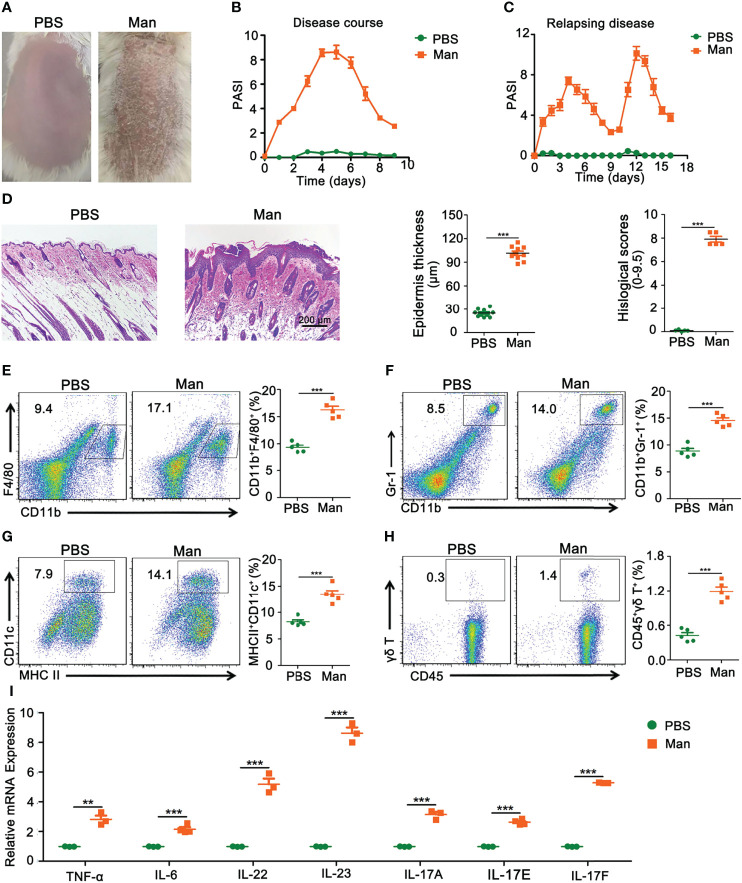
Characterization of mannan-induced skin inflammation. (A) Representative pictures of mouse skin after PBS or mannan application on Day 5 (n = 10/group). (B) Disease course after mannan or PBS application mixed with IFA in BALB/c mice on three consecutive days starting from Day 0 (n = 10/group); (C) relapsing mannan-induced skin inflammation (n = 10/group); (D) representative pictures of HE staining of psoriatic skin and statistical results of epidermal thickness with histological scores at peak of psoriasis (Scale bars: 200 μm) (n = 5/group). Representative pictures and statistical results on the expression of (E) macrophages (CD11b+F4/80+), (F) neutrophils (CD11b+Gr-1+), and (G) dendritic cells (MHCII+CD11c+) expression in spleen in mannan-induced skin inflammation on Day 5 (n = 5/group). (H) Representative pictures and percentage of γδT cells (CD45+γδT+) after PBS or mannan application on Day 5 in the draining lymph nodes (n = 5/group). (I) Expression of IL-23/IL-17 axis and its upstream cytokines (IL-6, TNF-α) (n = 3/group). Man, mannan. Statistical analyses were performed using an unpaired t test and n indicates number of mice in each group. The data represent mean ± SEM. **p < 0.01. ***p < 0.001.

