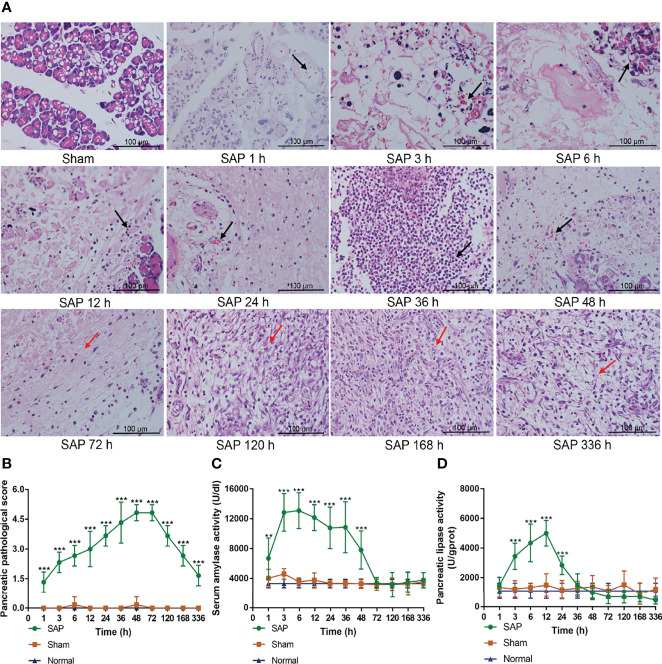
Figure 2.
Damage changes in the pancreas at different time points. (A) Pathological observation of pancreas (n = 3,200 × magnification, scale bar = 100 µm; the black arrow represents inflammation infiltration, edema, hemorrhage, and acinar cell necrosis, and the red arrow represents fibrous hyperplasia and granulation tissue). (B) Pancreatic pathological scores from 0 to 5. (C) Serum amylase activity. (D) Pancreatic lipase activity. Data are expressed as the mean ± SD (n = 6). **p < 0.01, ***p < 0.001 compared with the Sham group.

