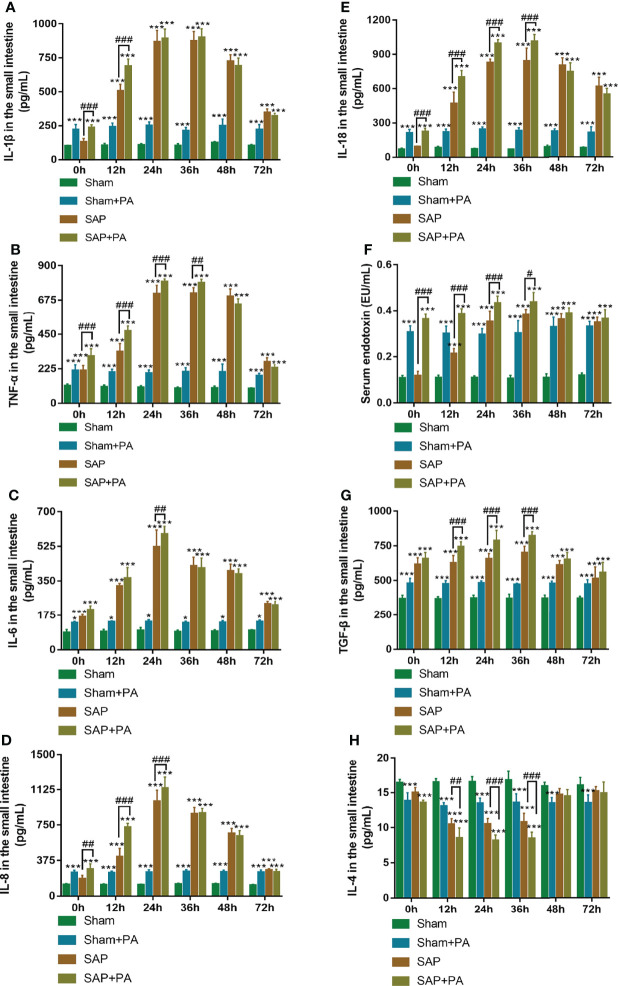
Figure 7.
Immune-inflammatory profile with immunosuppressed rats. (A–F) Levels of pro-inflammatory cytokines in the small intestines. (A) IL-1β. (B) TNF-α. (C) IL-6. (D) IL-8. (E) IL-18. (F) Serum endotoxin. (G, H) Levels of anti-inflammatory cytokines in the small intestines. (G) TGF-β. (H) IL-4. Data are expressed as the mean ± SD (n = 5). *p < 0.05, ***p < 0.001 compared with the Sham group; #p < 0.05, ##p < 0.01, ###p < 0.001 compared with the SAP group.

