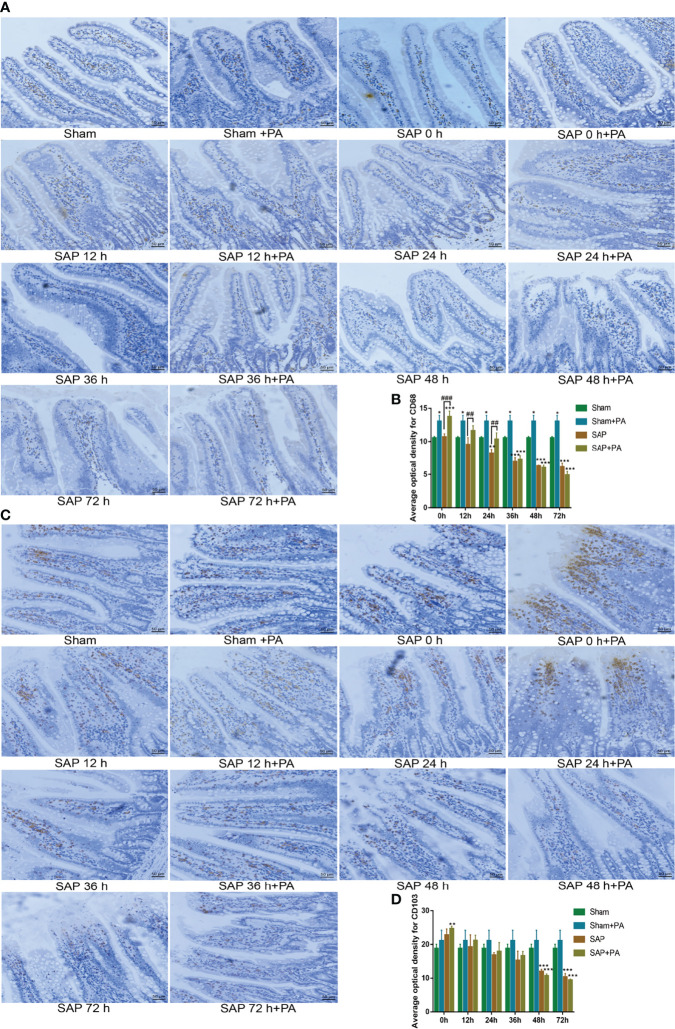
Figure 8.
Change of immune cells with immunosuppressed rats. (A, B) Measurement of macrophages in the small intestines. (A) Representative images of macrophages for immunohistological staining (200 × magnification, scale bar = 50 µm). (B) Average optical density of macrophages. (C, D) Measurement of dendritic cells in the small intestines. (C) Representative images of dendritic cells for immunohistological staining. (D) Average optical density of dendritic cells. Data are expressed as the mean ± SD (n = 3). *p < 0.05, **p < 0.01, ***p < 0.001 compared with the Sham group; ##p < 0.01, ###p < 0.001 compared with the SAP group.

