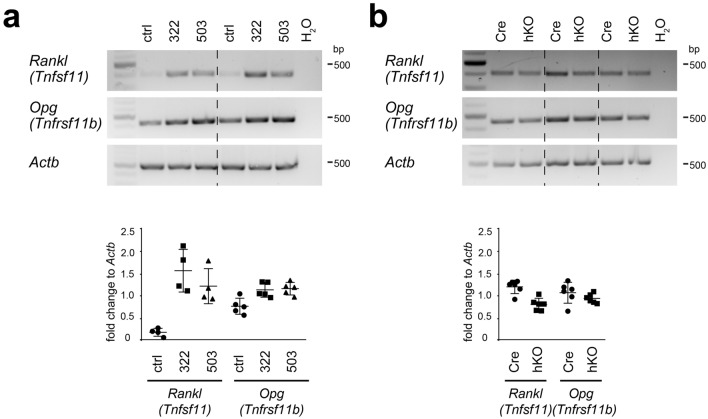
Figure 5.
Determination of Rankl and Opg gene expression in miRNA mimic-transfected chondrocytes and in cultured chondrocytes from Mirc24 cluster-deficient mice. The gene expression of Rankl and Opg was analyzed by semi-quantitative PCR (a) in control (ctrl), miR-322 (322) or miR-503 (503) mimic-transfected primary epiphyseal chondrocytes (PECs) 2 days post transfection and (b) in PECs isolated from newborn male Col2a1-Cre (Cre) and Col2a1-Cre-Mirc24tm1M/Y (hKO) mice and cultured for 2 days. The control (H2O) contains no genomic DNA and Actb served as loading control. Rankl or Opg to Actb ratio was determined by ImageJ and individual and mean values and standard deviations are shown (graph). The size of NEB Quick-Load Purple 1 kb Plus DNA Ladder bands is shown. The figure was created using Adobe Illustrator CS6 (Version 16.0.3, https://adobe.com/products/illustrator).

