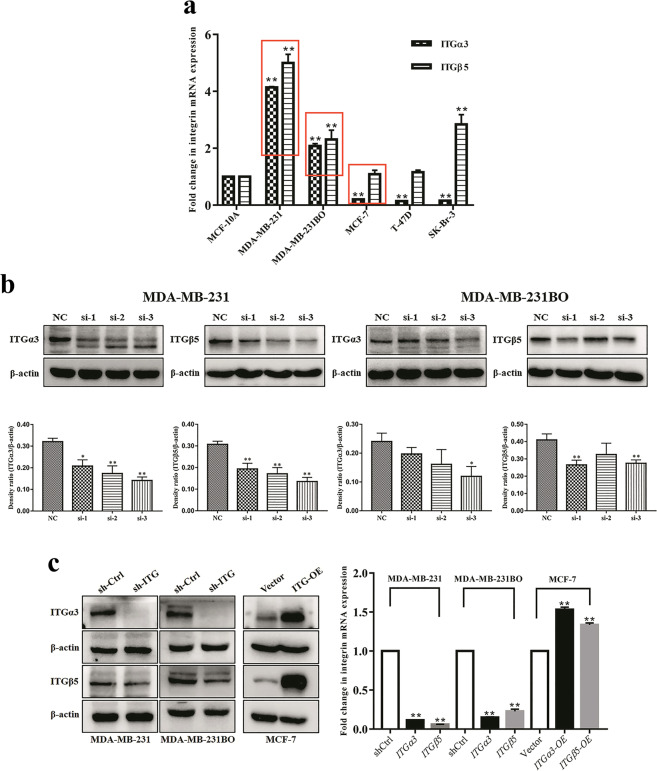
Fig. 4. Construction of stable ITGα3 or ITGβ5 knockdown and overexpression in human breast cancer cells.
a The mRNA expression of ITGα3 and ITGβ5 in breast cancer cells with different metastatic capability. Data were expressed as the mean ± SD for triplicate. **P < 0.01 vs. the MCF-10A group. b The determination of the most efficient shRNA interfering plasmid of ITGα3 and ITGβ5 in MDA-MB-231 and MDA-MB-231BO cells. *P < 0.05, **P < 0.01 vs. the negative control (NC). c The construction of ITGα3 or ITGβ5 knockdown cell lines (MDA-MB-231 and MDA-MB-231BO) and ITGα3 or ITGβ5 overexpression cell lines (MCF-7). **P < 0.01 vs. the shCtrl or the vector group. shCtrl: control vectors.

