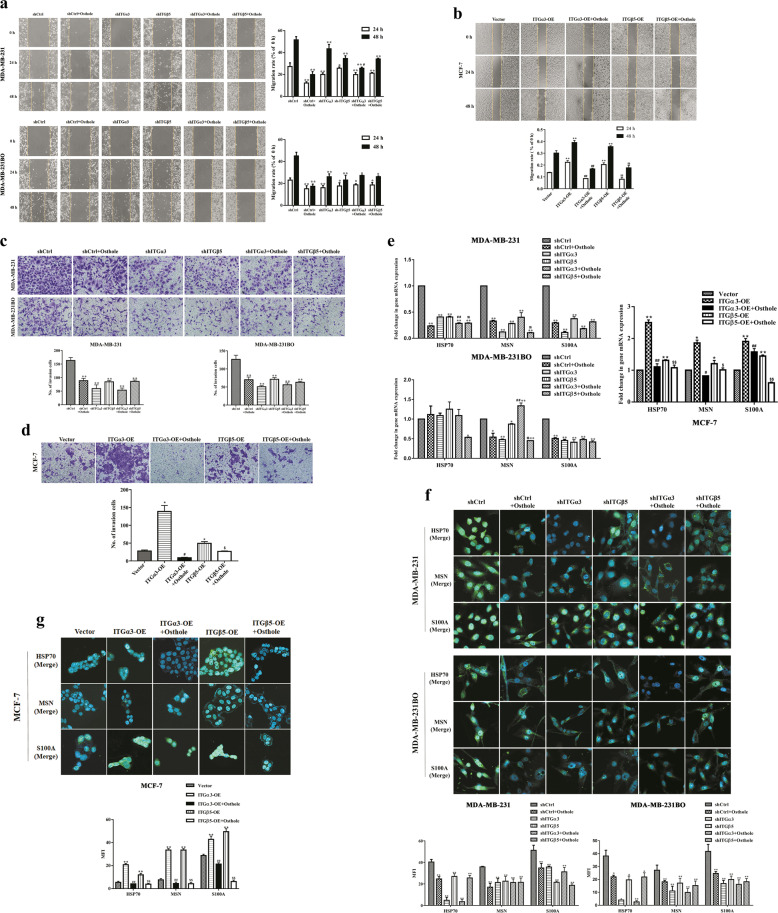
Fig. 5. Osthole prevents ITGα3- and ITGβ5-induced cell migration and invasion of highly metastatic breast cancer cells.
MDA-MB-231 and MDA-MB-231BO cells with shITGα3 or shITGβ5, and MCF-7 cells with ITGα3-OE or ITGβ5-OE were treated with 10 μg/mL of osthole for 24 h or 48 h, respectively. a, b The migration of different breast cancer cells was determined by wound-healing assay. a *P < 0.05, **P < 0.01 vs. the shCtrl group; #P < 0.05 vs. the shITGα3 group. b **P < 0.01 vs. the vector group; ##P < 0.01 vs. the ITGα3-OE group; $$P < 0.01 vs. the ITGβ5-OE group. c, d The invasion of different breast cancer cells was detected by Transwell assay. *P < 0.05, **P < 0.01 vs. the shCtrl or the vector group; #P < 0.05 vs. the ITGα3-OE group; $P < 0.05 vs. the ITGβ5-OE group. e The mRNA expression of metastasis-related biomarkers (HSP70, MSN and S100A) was evaluated by real-time PCR. *P < 0.05, **P < 0.01 vs. the shCtrl or the vector group; #P < 0.05, ##P < 0.01 vs. the shITGα3 or the ITGα3-OE group; $P < 0.05, $$P < 0.01 vs. the shITGβ5 or the ITGβ5-OE group. f, g The protein expression of metastasis-related biomarkers (HSP70, MSN and S100A) was analyzed by immunofluorescence assay. Scale bar = 20 μm. *P < 0.05, **P < 0.01 vs. the shCtrl or the vector group; ##P < 0.01 vs. the ITGα3-OE group; $$P < 0.01 vs. the ITGβ5-OE group. Amplification factors: 100× for a and b, and 200× for c and d. shCtrl: control vectors; MFI: mean fluorescence intensity.

