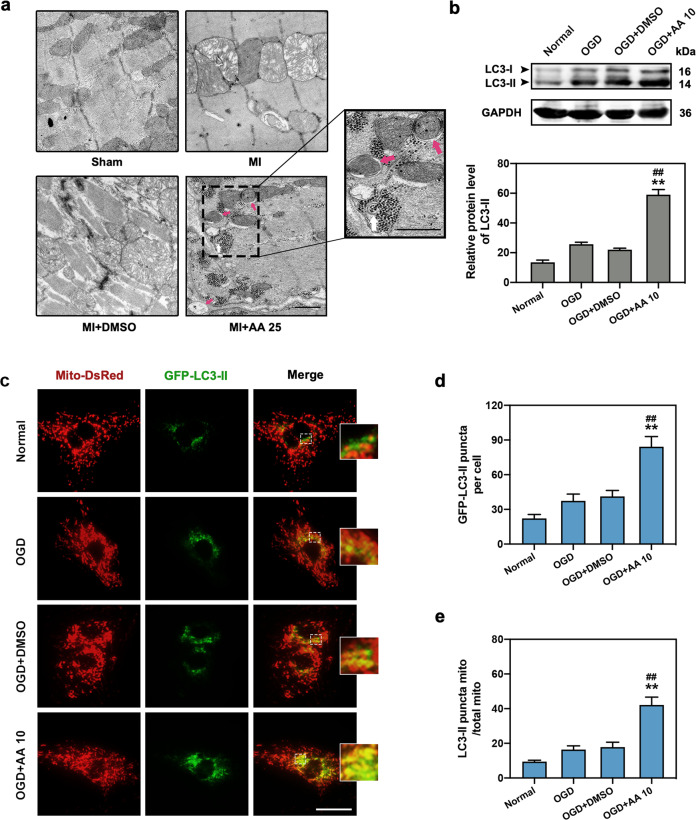
Fig. 3. AA increases ischemic cardiomyocyte mitophagy.
The dose of AA was 25 mg·kg−1·d−1 (AA 25) in vivo and 10 μmol/L (AA 10) in vitro. a Transmission electron micrograph of mitophagosomes enveloping mitochondria (red arrows) in the border zone of mouse MI (7 days) myocardium with AA 25 treatment; the box indicates the area enlarged on the lower right. Swollen mitochondria were observed in MI and MI + DMSO group, whereas mitochondrial damage was significantly alleviated in AA 25 group, bar: 500 nm. b Western blot and quantitative analysis of light chain 3 (LC3)-II expression in normal, OGD, OGD + DMSO, and OGD + AA 10-treated isolated cardiomyocytes, n = 4 independent experiments. c–e Representative images of isolated cardiomyocytes transfected with GFP-LC3-II adeno-associated virus and Mito-DsRed lentivirus (c); the number of LC3-II puncta (d) and the ratio of LC3-II positive mitochondria/total mitochondria (e) were determined, n = 5 independent experiments. Bar: 200 μm. **P < 0.01 vs. OGD group, ##P < 0.01 vs. OGD + DMSO group. Data are presented as the mean ± SEM.

