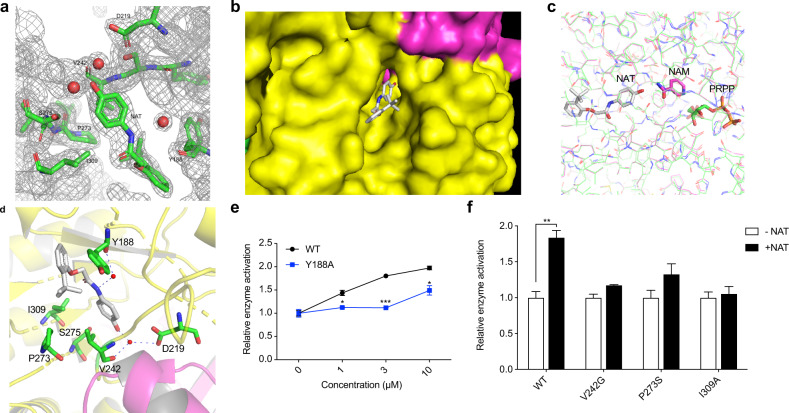
Fig. 2. X-ray crystal structure of purified, recombinant NAMPT bound to the NAT chemical.
a The 2Fo-Fc electron density map for NAT and its surrounding molecules at 2.2 Å resolution. The contour level is at 1 σ. b A surface display for the NAT-binding at the dimer interface of NAMPT. NAT is shown as sticks in gray. Two monomers of NAMPT are colored in yellow and rose, respectively. c Comparison of the binding site of NAT on NAMPT with that of NAM and PRPP. NAT and the corresponding NAMPT protein structure are shown in gray. NAM, rose; PRPP, green. d Ribbon diagram showing the NAT-binding site of NAMPT. NAT is shown as sticks in gray with hydrogen bonds represented as dashed lines. The water molecules are shown as small red spheres. The nearby residues are shown as sticks in green. The two NAMPT monomers are colored yellow and pink, respectively. e, f Sensitivity of the wild-type NAMPT and mutants to NAT. Enzyme activity was measured by the direct NAMPT assay. 0.1 μM recombinant protein of wild type NAMPT or mutant Y188A was incubated with the indicated concentrations of NAT (e). The enzyme activities of wild-type or the indicated NAMPT mutants were assayed in the absence or presence of 3 μM NAT (f).

