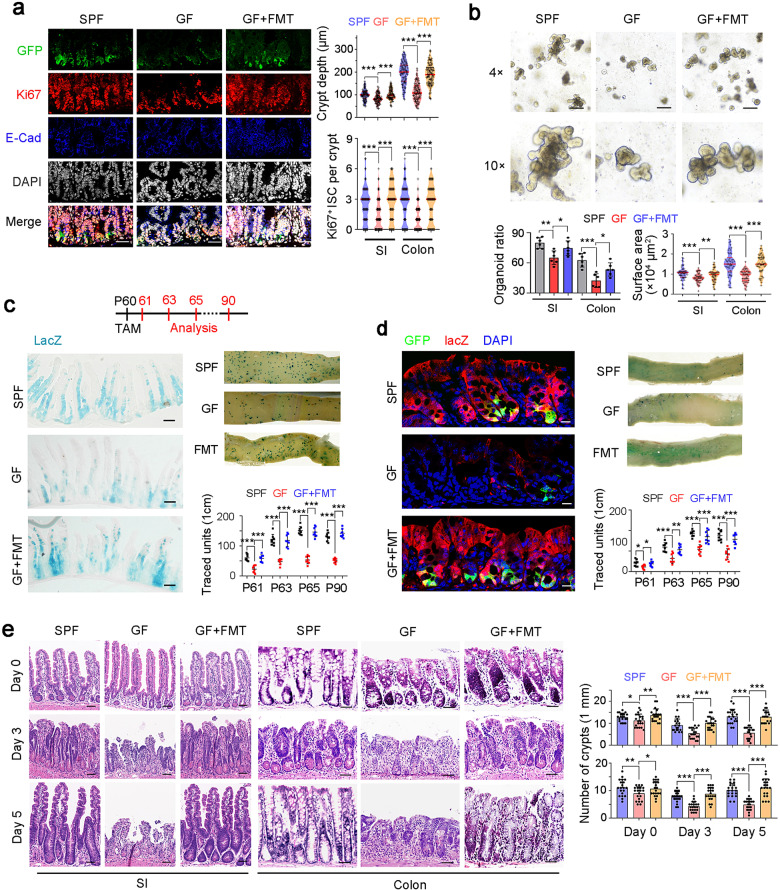
Fig. 1. Microbiota promotes ISC self-renewal.
a SPF mouse, GF mice and GF mice with FMT were used for ISC detection. Typical images are shown in the left panels, and statistical results of crypts (n = 100) from five mice are in the right panel. Scale bars, 50 μm. 7-day FMT treatment was used for microbiota recovery, and proper conventionalization and depletion were confirmed by RT-PCR detection of 16 S rRNA. b Organoid formation of crypts obtained from SPF mice, GF mice and GF mice with FMT. Typical images are shown in the upper panels, and organoid formation ratios and the surface area of organoid are shown in the lower panels. c SPF, GF, and FMT into GF Lgr5GFP-CreERT2; Rosa26lsl-lacZ (LRlacZ) mice were treated with tamoxifen (TAM) for lineage tracing analysis. Mice (n = 8) were sacrificed at the indicated time points and typical sections of postnatal day 65 (P65) were shown. Numbers of traced crypt-villus units (blue plots) at indicated time points were shown. d LRlacZ mice in SPF or GF states, and GF mice with FMT were treated with TAM for lineage tracing analysis. 5 days later, GFP and lacZ signals were detected by confocal microscopy. Representative images of 5 mice are shown. Scale bars, 20 μm. e SPF mice, GF mice and GF mice with FMT were treated with 10 Gy’s radiation, and sacrificed at indicated time points. Intestinal tissues were collected for H&E staining (left panel) and numbers of intact crypts were shown in the right panel (means ± SD). 20 fields from five mice were taken for each group. Scale bars, 100 μm. *P < 0.05, **P < 0.01, ***P < 0.001, by unpaired one-tailed Student’s t-test. Data were shown as means ± SD, and typical images are representative of three independent experiments.

