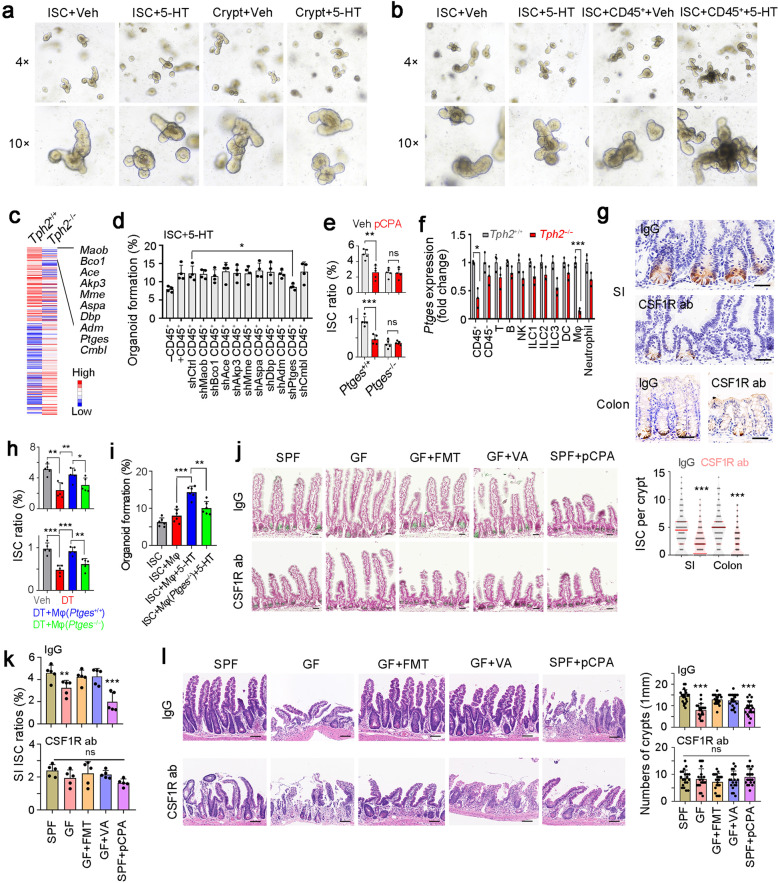
Fig. 5. 5-HT functions through macrophages.
a, b Organoid formation of ISC and crypt (a), or ISCs co-cultured with CD45+ cells (b). Organoid formation medium was supplemented with or without 5 μM 5-HT. 4 mice were used for organoid formation. c Heat map of Tph2-KO and control CD45+ cells, with top10 low expressed genes in Tph2 knockout cells listed in right. Red, high expression; Blue, low expression. d Organoid formation ratios of ISCs co-cultured with CD45+ immune cells in which indicated genes were silenced individually, supplemented with 5 μM 5-HT. Results are from 4 independent experiments. e ISC ratios of Ptges+/+ and Ptges−/− mice, which were treated with 150 mg/kg pCPA 3 days before ISC detection. 5 mice were used for ISC detection. f RT-PCR analysis for Ptges expression in indicated cells isolated from Tph2+/+ and Tph2−/− mice. 3 Tph2+/+ and Tph2−/− mice were used. g Lgr5 in situ hybridization in SI and colon tissues of macrophage-depleted mice, which were intraperitoneally injected with CSF1R ab (antibody, 10 mg/kg). 100 fields from five mice were taken for each group. Scale bars, 50 μm. h FACS detection for ISC ratios in SI and colon crypts from indicated treated mice. For each group, 5 Tph2DTR mice were treated with 100 ng DT every 3 days (twice), and adoptively transferred with 2 × 10⁶ macrophage cells (Mφ). Mφ were activated by 5 μM 5-HT for 8 h and ISCs were detected 2 days after Mφ adoptive transfer. i Organoid formation of ISCs, co-cultured with WT or Ptges-KO macrophages and 5 μM 5-HT. n = 6 mice were used for each group. j Lgr5 in situ hybridization was performed in small intestine from the indicated mice. Scale bars, 50 μm. k CSF1R antibody (ab) treated and control small intestine crypts were collected for ISC detection by FACS. 5 mice were used per group and ratios of ISCs were shown. l The indicated mice were treated with 10 Gy’s radiation, and sacrificed at 5 days after radiation. Intestinal tissues were collected for H&E staining (upper panel) and numbers of intact crypts were shown in lower panel (means ± SD). n = 20 fields from five mice were taken for each group. Scale bars, 100 μm. *P < 0.05, **P < 0.01, ***P < 0.001 by unpaired one-tailed Student’s t-test. At least three independent repeats were performed for each experiment and the representative results were shown.

