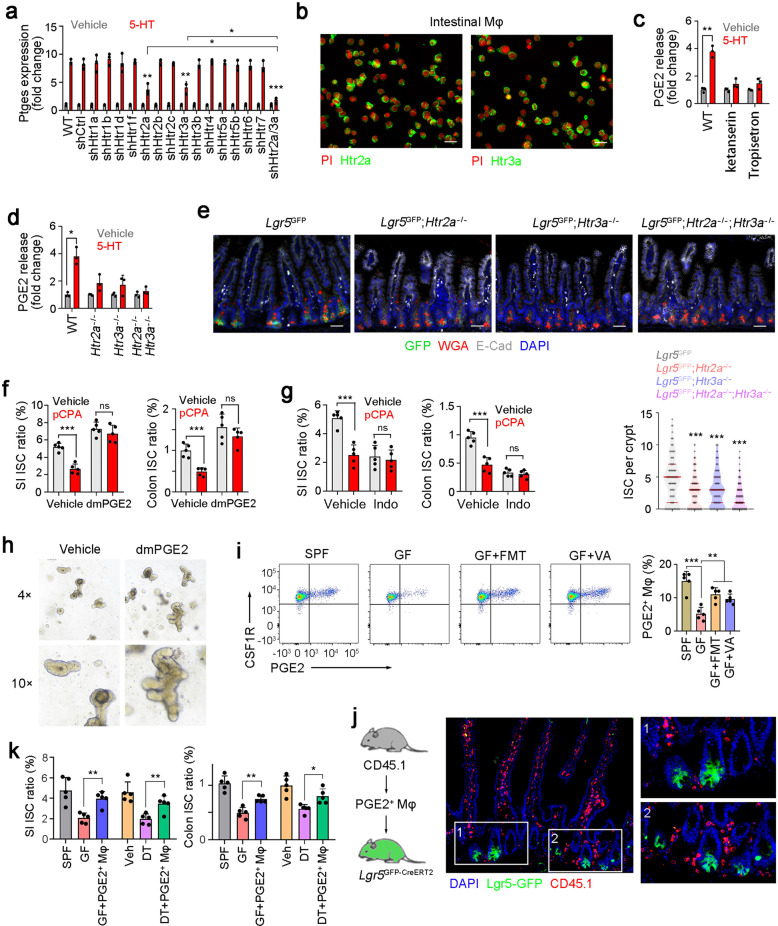
Fig. 6. 5-HT promotes PGE2 expression with engagement with its receptors HTR2A and HTR3A.
a RT-PCR detection of Ptges expression levels in 5-HT treated intestinal macrophages, in which the indicated 5-HT receptors were silenced individually. 2 × 10⁵ indicated silenced intestinal macrophages were treated with 5 μM 5-HT for 8 h, and Ptges expression was detected 24 h later. Results are from 3 independent assays. Htr knockdown efficiency was confirmed by RT PCR. b High expression of Htr2a and Htr3a in intestinal macrophage cells, which were enriched via FACS. c PGE2 production in macrophages treated with indicated inhibitors of 5-HT receptor. 10 μg/mL Ketanserin and 25 μg/mL Tropisetron were used and 3 independent experiments were performed. d ELISA detection for PGE2 production in microphages, which were sorted from 5-HT treated Htr2a KO, Htr3a KO, or DKO mice. All PGE2 levels were normalized to those of Vehicle treated mice (n = 3 per group). e Fluorescence staining of intestinal tissue from 2-month-old Lgr5GFP, Lgr5GFP; Htr2a−/−, Lgr5GFP; Htr3a−/−, and Lgr5GFP; Htr2a−/−; Htr3a−/− mice. 100 fields from five mice were observed. f, g FACS detection for ISC ratios in SI or colon tissues from dmPGE2-treated (f) or indomethacin (Indo)-treated (g) mice. 5 mg/kg dmPGE2, 10 mg/kg indo and 150 mg/kg pCPA were intraperitoneally injected and 5 mice were used per group. h Organoid formation of ISCs, supplemented with/without 1 μM dmPGE2. Typical organoid images of three independent assays were shown. i PGE2 expression was analyzed in CSF1R+ macrophage cells, which were obtained from SI tissues of SPF, GF, GF + FMT, and GF + VA mice. 5 mice were used for each group. Typical FACS results were shown in the left panel, and PGE2+ macrophage ratios were in the right panel. j PGE2+ macrophages were isolated from ileum tissues of CD45.1 mice, and transferred to Lgr5GFP mice, and SI tissue location of CD45.1+ macrophages was shown. 2 × 10⁶ live PGE2+ macrophages were used for each mouse. k PGE2+ macrophage-transfer assay was performed to GF-Lgr5GFP mice and DT-treated Lgr5GFPTph2DTR mice, and ISC ratios were measured with FACS. SI and colon tissues were measured. n = 5 mice per group. *P < 0.05, **P < 0.01, ***P < 0.001 by unpaired one-tailed Student’s t-test; ns, not significant.

