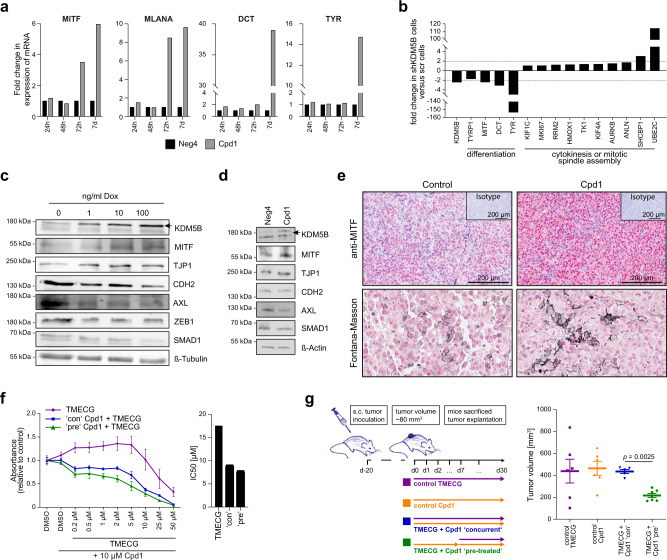
Fig. 6. Enforced KDM5B expression facilitates melanocytic lineage-directed elimination by TMECG.
a Quantitation of mRNA after 24 h, 48 h, 72 h and 7 days of Cpd1 treatment of MaMel63a cells as assessed by qPCR. Mean ± SD. Shown is one representative example. b Regulation of differentiation, cytokinesis, and mitotic spindle assembly genes as detected by cDNA microarray analysis after KDM5B shRNA knockdown in WM3734 cells (n = 1). c, d Immunoblotting of melanocytic lineage and (de-)differentiation markers after 24 h of KDM5B induction in WM3734Tet3G-KDM5B cells (c) and after 72 h of Cpd1 treatment in MaMel63a cells (d). Shown are representative data (n = 2). e Anti-MITF immunostaining (upper panel) and Fontana-Masson staining (lower panels) of CM melanoma tumor grafts from Cpd1-treated vs. control mice. f MTT cell viability assay of WM3734 cells. Representative example is shown left (mean ± SD, n = 2) and corresponding IC50 values on the right. TMECG was either concurrently given together with Cpd1 (“con”) or added 3 days after Cpd1 pre-treatment (“pre”). Readout was performed after 72 h of TMECG treatment. g Persister-state-directed therapy model in vivo. Left: schematic representation of treatment dosing and timing in immunodeficient NMRI-(nu/nu)-nude mice. Right: tumor volumes of WM3734 xenografts (endpoint at day 30). TMECG was either concurrently given together with Cpd1 (“con”) or added one week after Cpd1 pre-treatment (“pre”). Mean ±SEM (6 mice in TMECG and Cpd1 control group, five mice in “con” and seven mice in “pre” group). Significance was determined by two-sided Mann–Whitney test. Source data are provided as a Source Data file.

