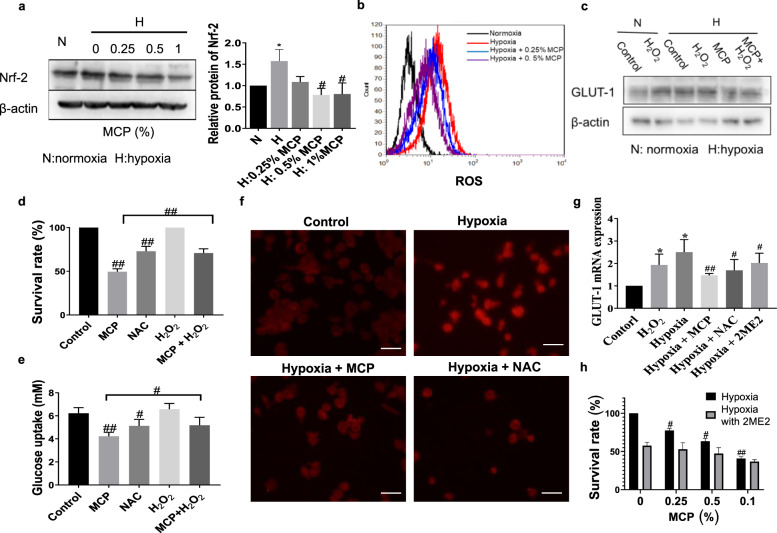
Fig. 2. MCP inhibited GLUT-1 expression of TAM by inhibiting ROS and HIF-1α.
a Effect of MCP on the expression of Nrf-2 in TAM at the indicated concentrations for 24 h was detected by Western blotting method. b Effect of MCP on the ROS level was detected by flow cytometry method. c Effect of H2O2 (10 μmol/L) on the GLUT-1 expression of TAM in hypoxia treated with MCP for 24 h was detected by Western blotting method. d Effect of H2O2 on the survival of TAM treated with MCP in hypoxia for 24 h was detected by CCK-8 assay. e Effect of H2O2 on the glucose uptake of TAM treated with 0.5% MCP in hypoxia for 24 h was detected by the glucose assay kit. f Immunofluorescence images of HIF-1α in hypoxia TAM treated with 0.5% MCP, NAC (10 nM, pretreatment for 1 h) (magnification, ×100, bar = 200 μm). g Effects of 0.5% MCP, NAC (10 nM, pretreatment for 1 h) and 2ME2 (10 μM, pretreatment for 0.5 h) on mRNA expression of GLUT-1 in TAM under hypoxia were assessed by RT-PCR. h Effect of MCP or/and 2ME2 (10 μM, pretreatment for 0.5 h) on cell viability of TAM in hypoxia at the indicated concentrations for 24 h was detected by the CCK-8 assay. All the experiments have been repeated three times. *P < 0.05 vs. respective normaxia control group, #P < 0.05, ##P < 0.01, vs. respective hypoxia control group.

