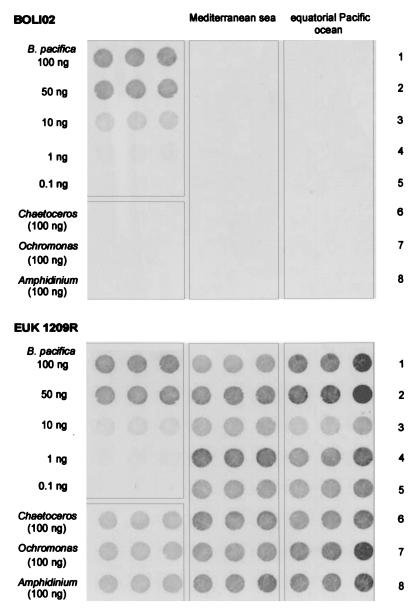
FIG. 3.
Dot blots with the BOLI02 probe (top) and the general eukaryotic probe EUK 1209R (bottom) used successively on the same membrane. All spots were made in triplicate to better assess the variability of the hybridization method for a single sample. The upper left square of each panel corresponds to the positive control (B. pacifica DNA) deposited at different concentrations. The lower left square corresponds to 100 ng of DNAs from different negative controls. The middle part corresponds to 100-ng quantities of DNA amplified from Mediterranean Sea samples, each of them corresponding to a different row, as follows: row 1, MIN17 at 10 m; row 2, MIN17 at 60 m; row 3, MIN34 at 15 m; row 4, MIN34 at 50 m; and row 5, MIN44 at 20 m; row 6, MIN44 at 85 m; row 7, MIN52 at 20 m; and row 8, MIN52 at 70m. The right part of each panel corresponds to 100-ng quantities of DNA amplified from equatorial Pacific samples, each of them corresponding to a different row, as follows: row 1, OLI16 at 15 m; row 2, OLI16 at 75 m; row 3, OLI26 at 15 m; row 4, OLI26 at 60 m; row 5, OLI41 at 15 m; row 6, OLI41 at 75 m; row 7, OLI51 at 15 m; and row 8, OLI51 at 60 m.

