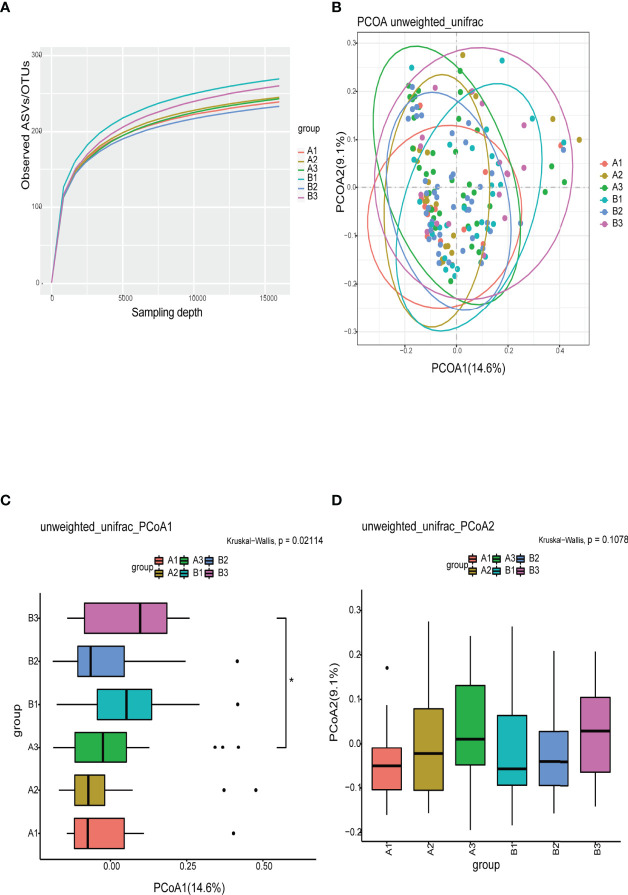
Figure 3.
(A) Refraction curves based on random extraction of sequencing data from fecal samples from the six subgroups. (B–D) β-diversity analysis conducted with the unweighted unifrac algorithm. Ellipses represent 95% confidence intervals for each subgroup in Figure 3B . *P<0.05. A1, TPOAb-positive women with SCH and no LT4; A2, TPOAb-positive women with SCH and low-dose LT4; A3, TPOAb-positive women with SCH and high-dose LT4; B1, TPOAb-negative women with SCH and no LT4; B2, TPOAb-negative women with SCH and low-dose LT4; B3, TPOAb-negative women with SCH and high-dose LT4.

