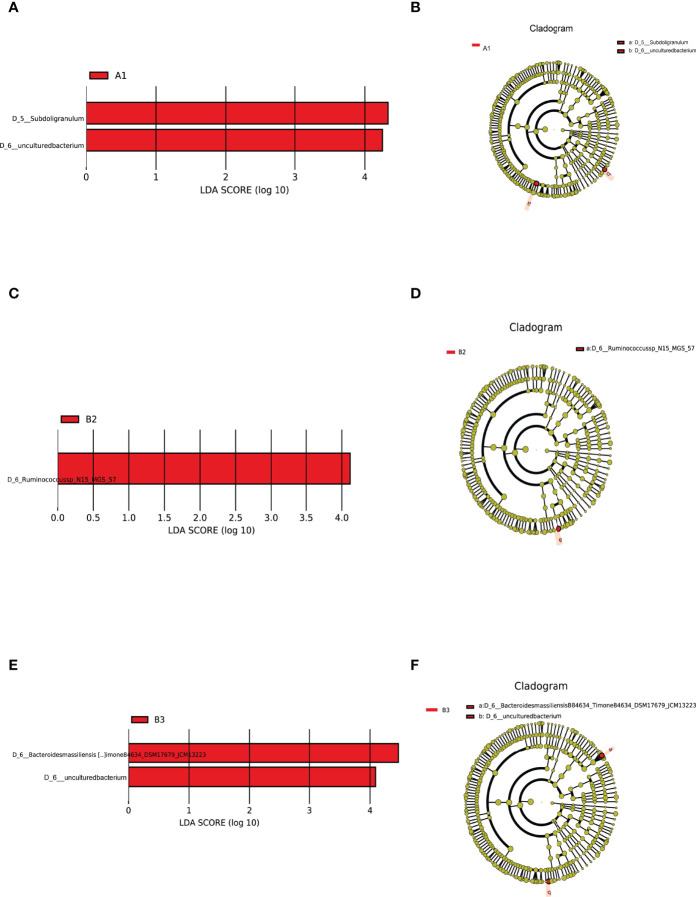
Figure 4.
Intestinal flora as markers in TPOAb-positive women with SCH. LEfSe analysis of differential species abundance. (A, B) TPOAb-positive vs. TPOAb-negative women with SCH and no LT4; (C, D) TPOAb-positive vs. TPOAb-negative women with SCH and low-dose LT4; (E, F) TPOAb-positive vs. TPOAb-negative women with SCH and high-dose LT4. LDA value distribution histogram: red bars indicate higher abundance of intestinal flora. Cladograms: circles radiating from the inside to the outside represent taxonomic levels from phylum to species. A1, TPOAb-positive women with SCH and no LT4; A2, TPOAb-positive women with SCH and low-dose LT4; A3, TPOAb-positive women with SCH and high-dose LT4; B1, TPOAb-negative women with SCH and no LT4; B2, TPOAb-negative women with SCH and low-dose LT4; B3, TPOAb-negative women with SCH and high-dose LT4.

