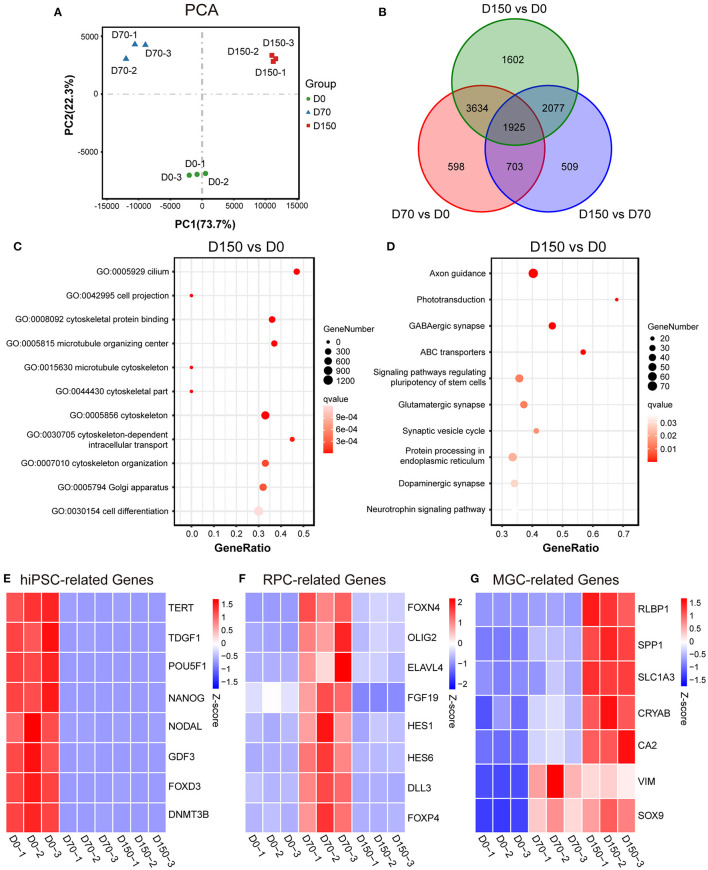
Figure 2.
RNA-seq analysis of MGC development in ROs at different stages. (A) Principal components analysis (PCA) showed a comparison of the transcriptome data in hiPSCs (D0) and ROs at different stages. (B) Venn diagram showed the number and overlapping relations of the differentially expressed genes (DEGs) among hiPSCs and ROs at different stages. (C) Dot plot showed Gene Ontology (GO) analysis of the upregulated DEGs of D150-ROs comparing to hiPSCs; GO terms with an adjust p-value (qvalue) ≤ 0.05 were defined as significant enriched GO terms. (D) Dot plot showed Kyoto Encyclopedia of Genes and Genomes (KEGG) analysis of the upregulated DEGs of D150-ROs comparing to hiPSCs; signaling pathways with qvalue ≤ 0.05 were defined as significant enriched pathways. (E–G) Heatmap showed the expression pattern of the hiPSC-related genes (E), RPC-related genes (F) and MGC-related genes (G) in hiPSCs (D0), D70-ROs (D70), and D150-ROs (D150). Blue to red indicated a gradient from low to high gene expression. hiPSC, human induced pluripotent stem cell; NR, neural retina; ROs, retinal organoids; RPC, retinal progenitor cell; MGC, Müller glial cell; −1, −2, and −3, experimental replicates; VS, versus. VIM, gene name of vimentin; RLBP1, gene name of CRALBP.

