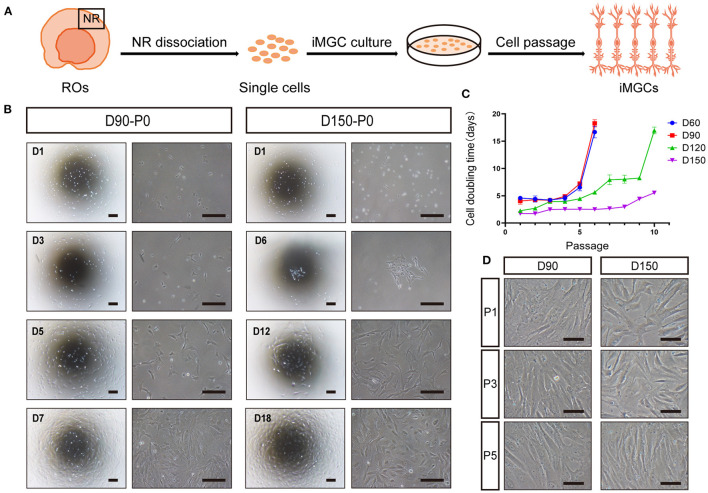
Figure 3.
Optimal expansion of induced MGCs (iMGCs) from hiPSC-derived ROs. (A) Schematic diagram of expansion of iMGCs from hiPSC-derived ROs. (B) Bright-field images showed the distinguished morphological features of the passage 0 (P0) cells isolated from D90-ROs (D90-P0) and D150-ROs (D150-P0). (C) The cell doubling time showed different expansion capability of cells isolated from D60-, D90-, D120-, and D150-ROs. (D) Bright-field images showed no obvious morphological difference in P1, P3, and P5 cells expanded from D90- and D150-ROs, all appearing a spindle-like shape. ROs, retinal organoids; NR, neural retina. Scale bars = 200 μm (B) and 100 μm (D).

