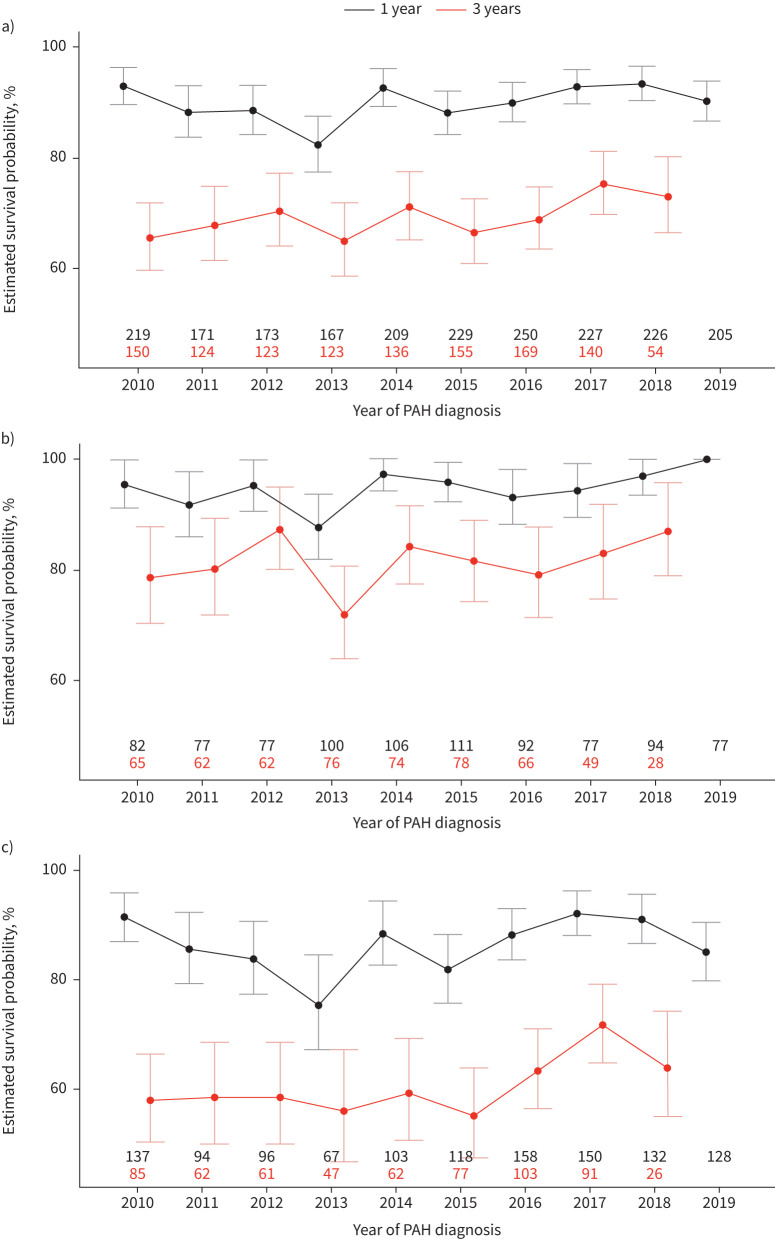
FIGURE 4.
Annualised survival rates (95% CI) at 1 and 3 years after pulmonary arterial hypertension (PAH) diagnosis in a) the entire cohort, and in the subgroups of patients aged b) <65 years and c) ≥65 years. The black and red numbers indicate the numbers of patients available for the annualised 1- and 3-year survival rates, respectively.

