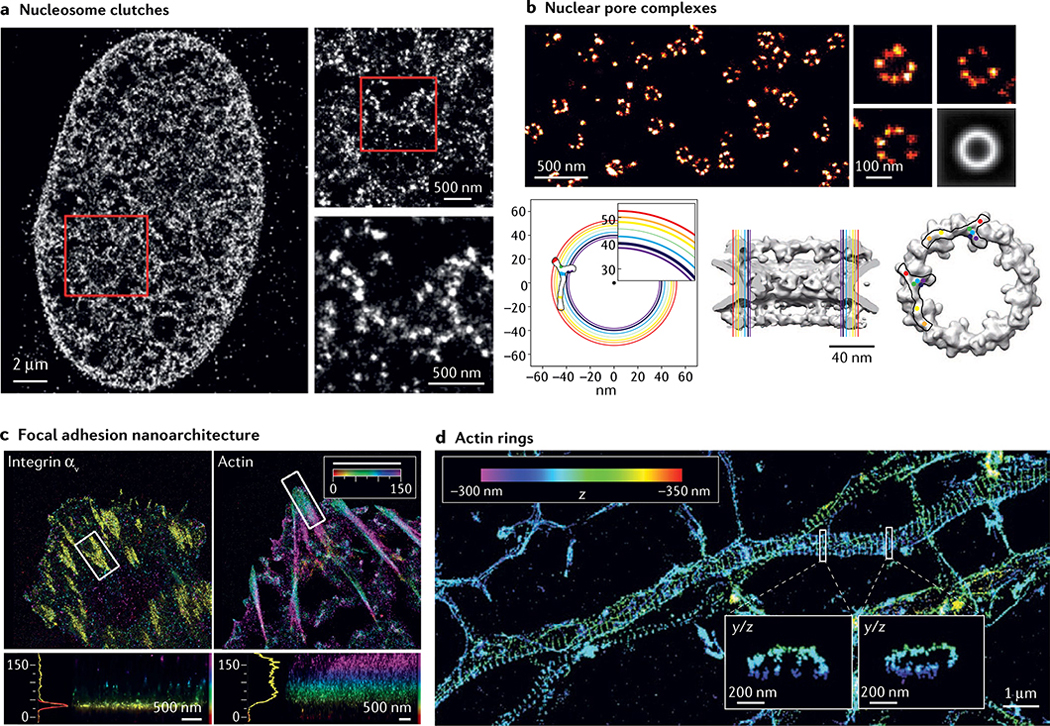
Fig. 5 |. Major discoveries enabled by single-molecule localization microscopy.
a | Stochastic optical reconstruction microscopy (STORM) image of histone H2B in human fibroblast cells with progressively higher zoomed insets. b | Top: direct STORM (dSTORM) image of nuclear pore complexes (NPCs) labelled with antibodies to the nucleoporin Nup133. Three individual NPCs are shown on the right and an average image of 4,171 aligned NPCs on the lower right. Bottom left: coloured circles show radial positions of different nucleoporins in the plane of the nuclear envelope, determined from averaged dSTORM images, with the inferred position of the Y-shaped scaffold complex overlaid. Circle thickness reflects 95% confidence intervals of average radial distances. Bottom centre and bottom right: side and frontal views of the electron microscopy structure (grey), with the radial positions of nucleoporins shown in colour, and two positions of the Y complex consistent with the dSTORM data overlaid. c | Interferometric photoactivated localization microscopy (iPALM) image of a human U2OS cell expressing integrin αν-tdEos (left) and actin-mEos2 (right) with colour-coded zoomed insets of boxed regions. Colours represent the z position relative to the substrate (z = 0 nm). d | 3D STORM image of actin in a neuronal axon with zoomed y/z insets of boxed regions showing actin rings. Part a adapted with permission from REF.136, Elsevier. Part b reprinted with permission from REF.120, AAAS. Part c adapted from REF.168, Springer Nature Limited. Part d reprinted with permission from REF.58, AAAS.

