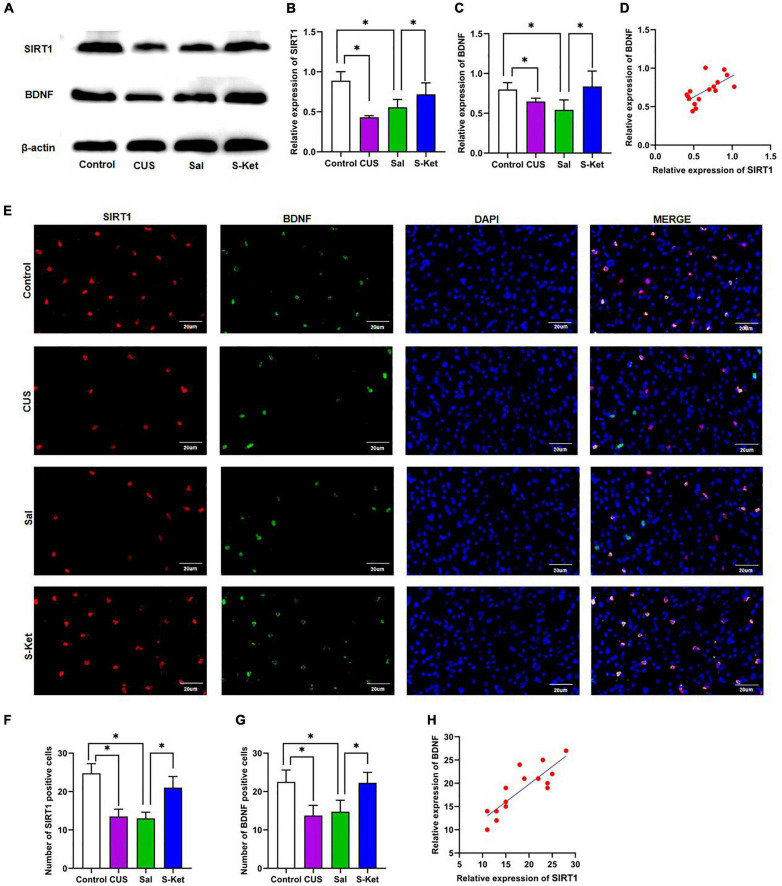
FIGURE 4.
S-ketamine upregulated the SIRT1 and BDNF expression in mPFC. (A) Bands of SIRT1 and BDNF obtained from the Western blot test. (B) Relative expression of SIRT1 protein (n = 3). (C) Relative expression of SIRT1 protein (n = 3). (D) Correlation between SIRT1 protein and BDNF protein. (E) Images of SIRT1- and BDNF-positive cells obtained from the immunofluorescence test. (F) Number of SIRT1-positive cells (n = 3). (G) Number of BDNF-positive cells (n = 3). (H) Correlation between SIRT1-positive and BDNF-positive cells. The photomicrographs are typical images of SIRT1- and BDNF-positive cells (400×). The data are expressed as the mean ± standard error, and ∗P < 0.05.

