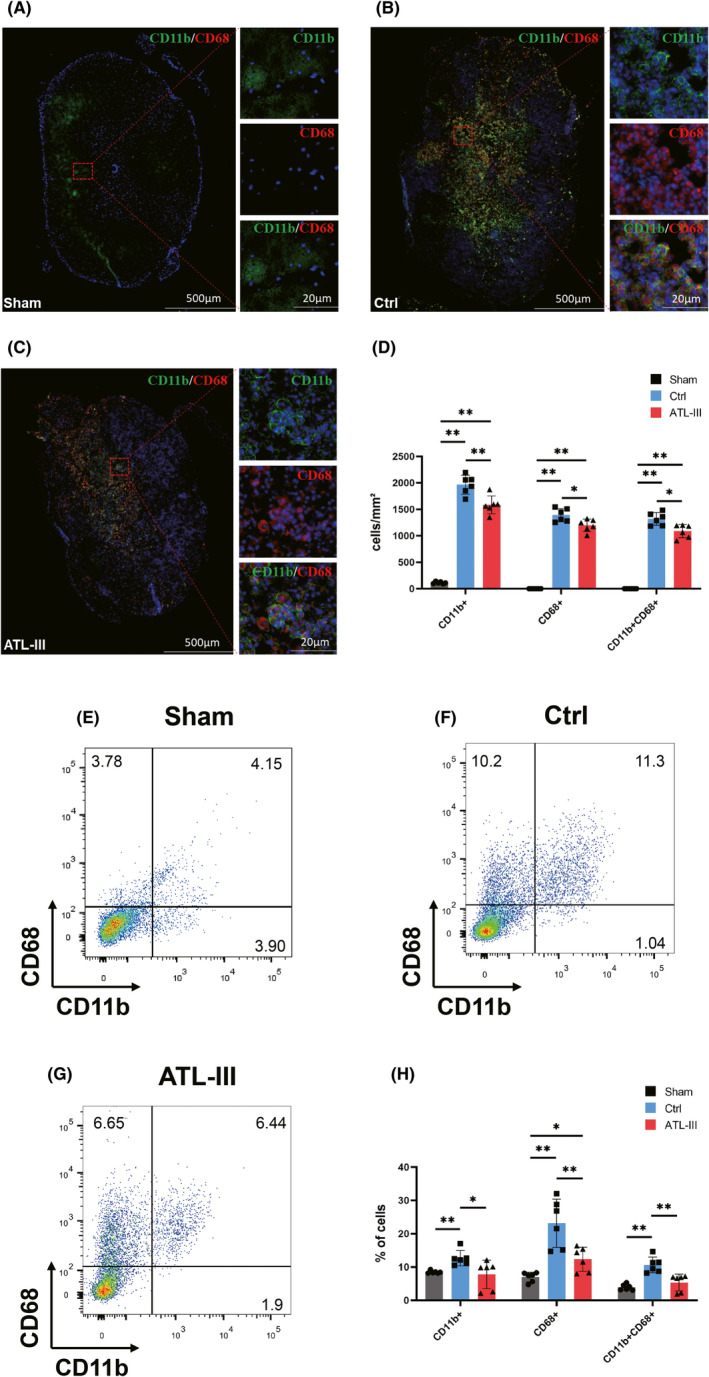
FIGURE 3.

ATL‐III reduced the number of activated microglia/macrophages in SCI rats, as determined by immunohistofluorescence and flow cytometry. (A–C) Representative images of CD11b (green), CD68 (red) and nuclei (blue) in the spinal cords of sham, control, and ATL‐III rats. (D) The numbers of CD11b+, CD68+ and CD11b+CD68+ cells. (E–G) Typical flow cytometry images of myeloid tissues from sham, control, and ATL‐III rats. (H) Proportions of CD11b+, CD68+, and CD11b+CD68+ cells. The data are presented as the mean ± SD (n = 6). *p < 0.05, **p < 0.01
