
FIGURE 1.
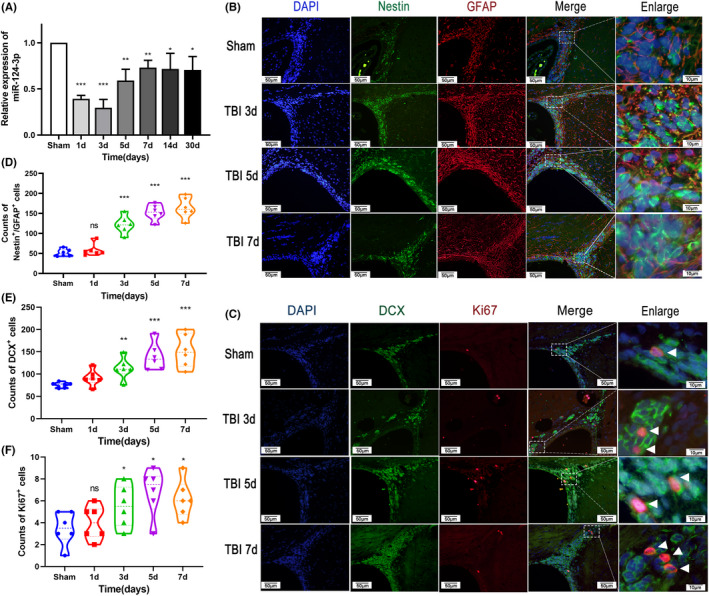
Time course of miR‐124‐3p expression and the status of NSCs in the SVZ post‐TBI. (A) Qrt‐PCR analysis of the expression of miR‐124‐3p. The expression of miR‐124‐3p decreased sharply in the first 3 days after TBI and then increased slightly and was sustained until Day 30. The expression level at Day 30 was still lower than that in the sham group. (B–F) The status of NSCs was examined with immunofluorescence was performed 3, 5, and 7 days after TBI (n = 6 per group). (E) Representative photographs showing double immunofluorescence staining for Nestin (green) and GFAP (red) in the SVZ postinjury. Scale bar = 100 μm. (B) The number of Nestin+/GFAP+ cells increased gradually post‐TBI. (F) Representative photographs showing double IF staining for DCX (green) and Ki67 (red) in the SVZ postinjury. Scale bar = 100 μm. (C) The number of Ki67+ cells increased post‐TBI. (D) DCX+ cells increased post‐TBI. The data are presented as the means ± SD. ⁎ p < 0.05, ⁎⁎ p < 0.01, and ⁎⁎⁎ p < 0.001 vs. the sham group