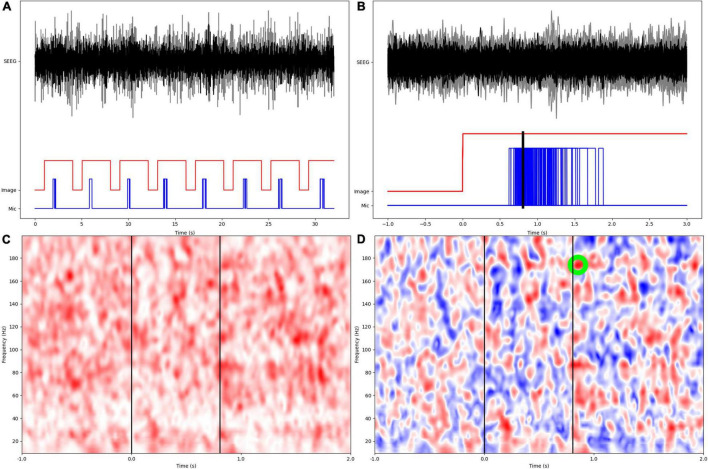
FIGURE 1.
Overview of experimental design and signal processing. (A) SEEG data from two different anatomic parcels (black, gray), image display, and patient microphone digital input channels. (B) Epochs are aligned at the onset of image display, with a preceding 1s inter-trial baseline. Mean response time is calculated as arithmetic mean of times from image display to onset of verbal responses. (C) Wavelet based coherence calculation in the time-frequency space. (D) Coherence modulations are computed as z-scores based on distribution of coherence during the inter-trial baseline. The largest z-score within the naming phase (0–2s from image display) is identified and retained for subsequent statistical analyses.

