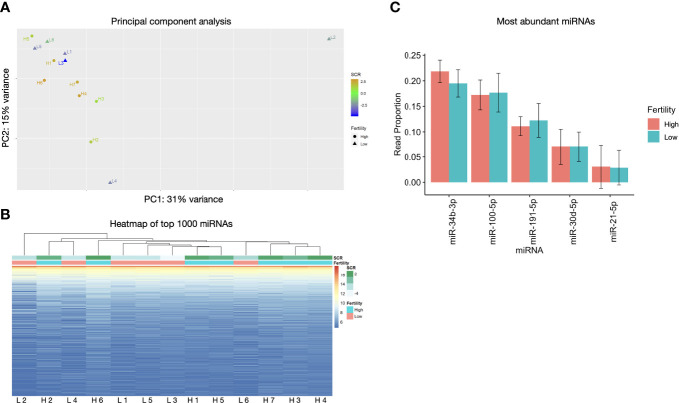
Figure 2.
miRNA populations are broadly similar across fertility groups. (A) Principal component analysis does not show significant clustering correlated with fertility. (B) Heatmap of top 1000 expressed miRNAs shows minimal association between samples of like fertility conditions. (C) The 5 most abundant miRNAs exhibit no significant differences and are ranked the same in enhanced and standard fertility animals. Error bars are ± SD.

