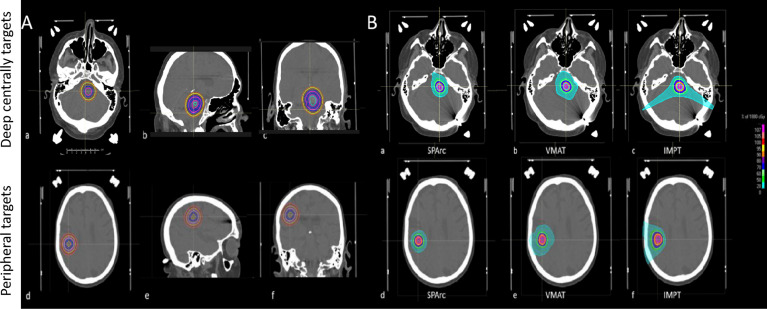
Figure 1.
(A) Target’s locations and sizes (from 0.3cc to 33.03cc) in the brain SRS dosimetric model. Deep centrally located targets (a, b, c); Peripheral targets (d, e, f). (B) A representative transverse view of dose distributions among SPArc, IMPT, and VMAT on the 0.3cc target. Deep centrally located 0.3cc target (a) SPArc, (b) VMAT, (c) IMPT; Peripheral 0.3cc target (d) SPArc, (e) VMAT, (f) IMPT.

