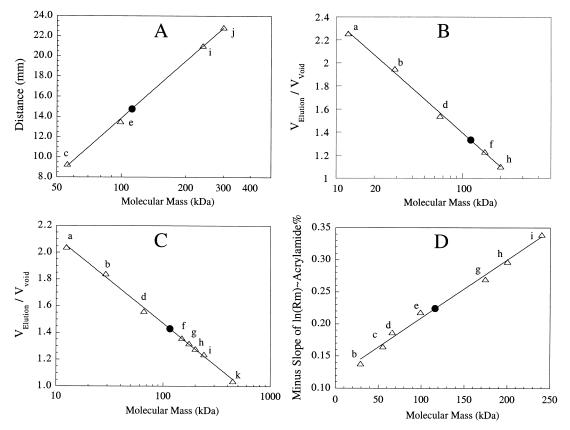
FIG. 5.
Native molecular mass of recombinant I-1-Pase from T. maritima. (A) Calibration curve (▵) and position of T. maritima I-1-Pase (●) obtained after centrifugation in a 6 to 25% linear sucrose density gradient. (B and C) Gel filtration with Sephadex G-150 (B) and Bio-Gel A 0.5 m resin (C). (D) Negative slopes, obtained from plots of relative mobilities of standards and T. maritima I-1-Pase versus gel concentration (7 to 12% polyacrylamide gels). The molecular mass standards used were cytochrome c (12.4 kDa) (a), carbonic anhydrase (29 kDa) (b), M. jannaschii I-1-Pase (56 kDa) (c), bovine serum albumin (66 kDa) (d), ATCase catalytic subunit (99 kDa) (e), alcohol dehydrogenase (150 kDa) (f), A. fulgidus I-1-P synthase (174 kDa) (g), β-amylase (200 kDa) (h), yeast I-1-P synthase (240 kDa) (i), ATCase holoenzyme (300 kDa) (j), and apoferritin (442 kDa) (k).

