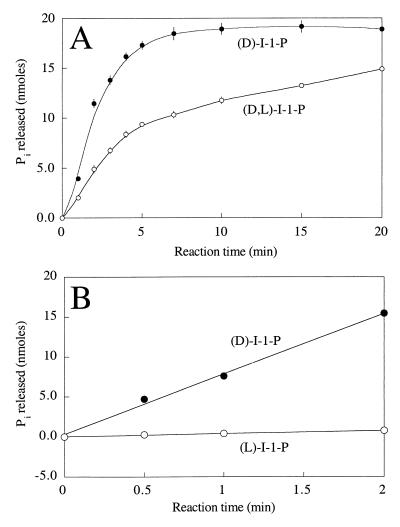
FIG. 7.
(A) Time course of Pi release from d-I-1-P (●) and dl-I-1-P (○) (20 nmol) after incubation at 90°C with 0.17 μg of enzyme. (B) Time course of Pi release from pure d-I-1-P (●) and l-I-1-P (○) after incubation at 90°C with T. maritima I-1-Pase. The released Pi was quantified by a colorimetric phosphate assay.

