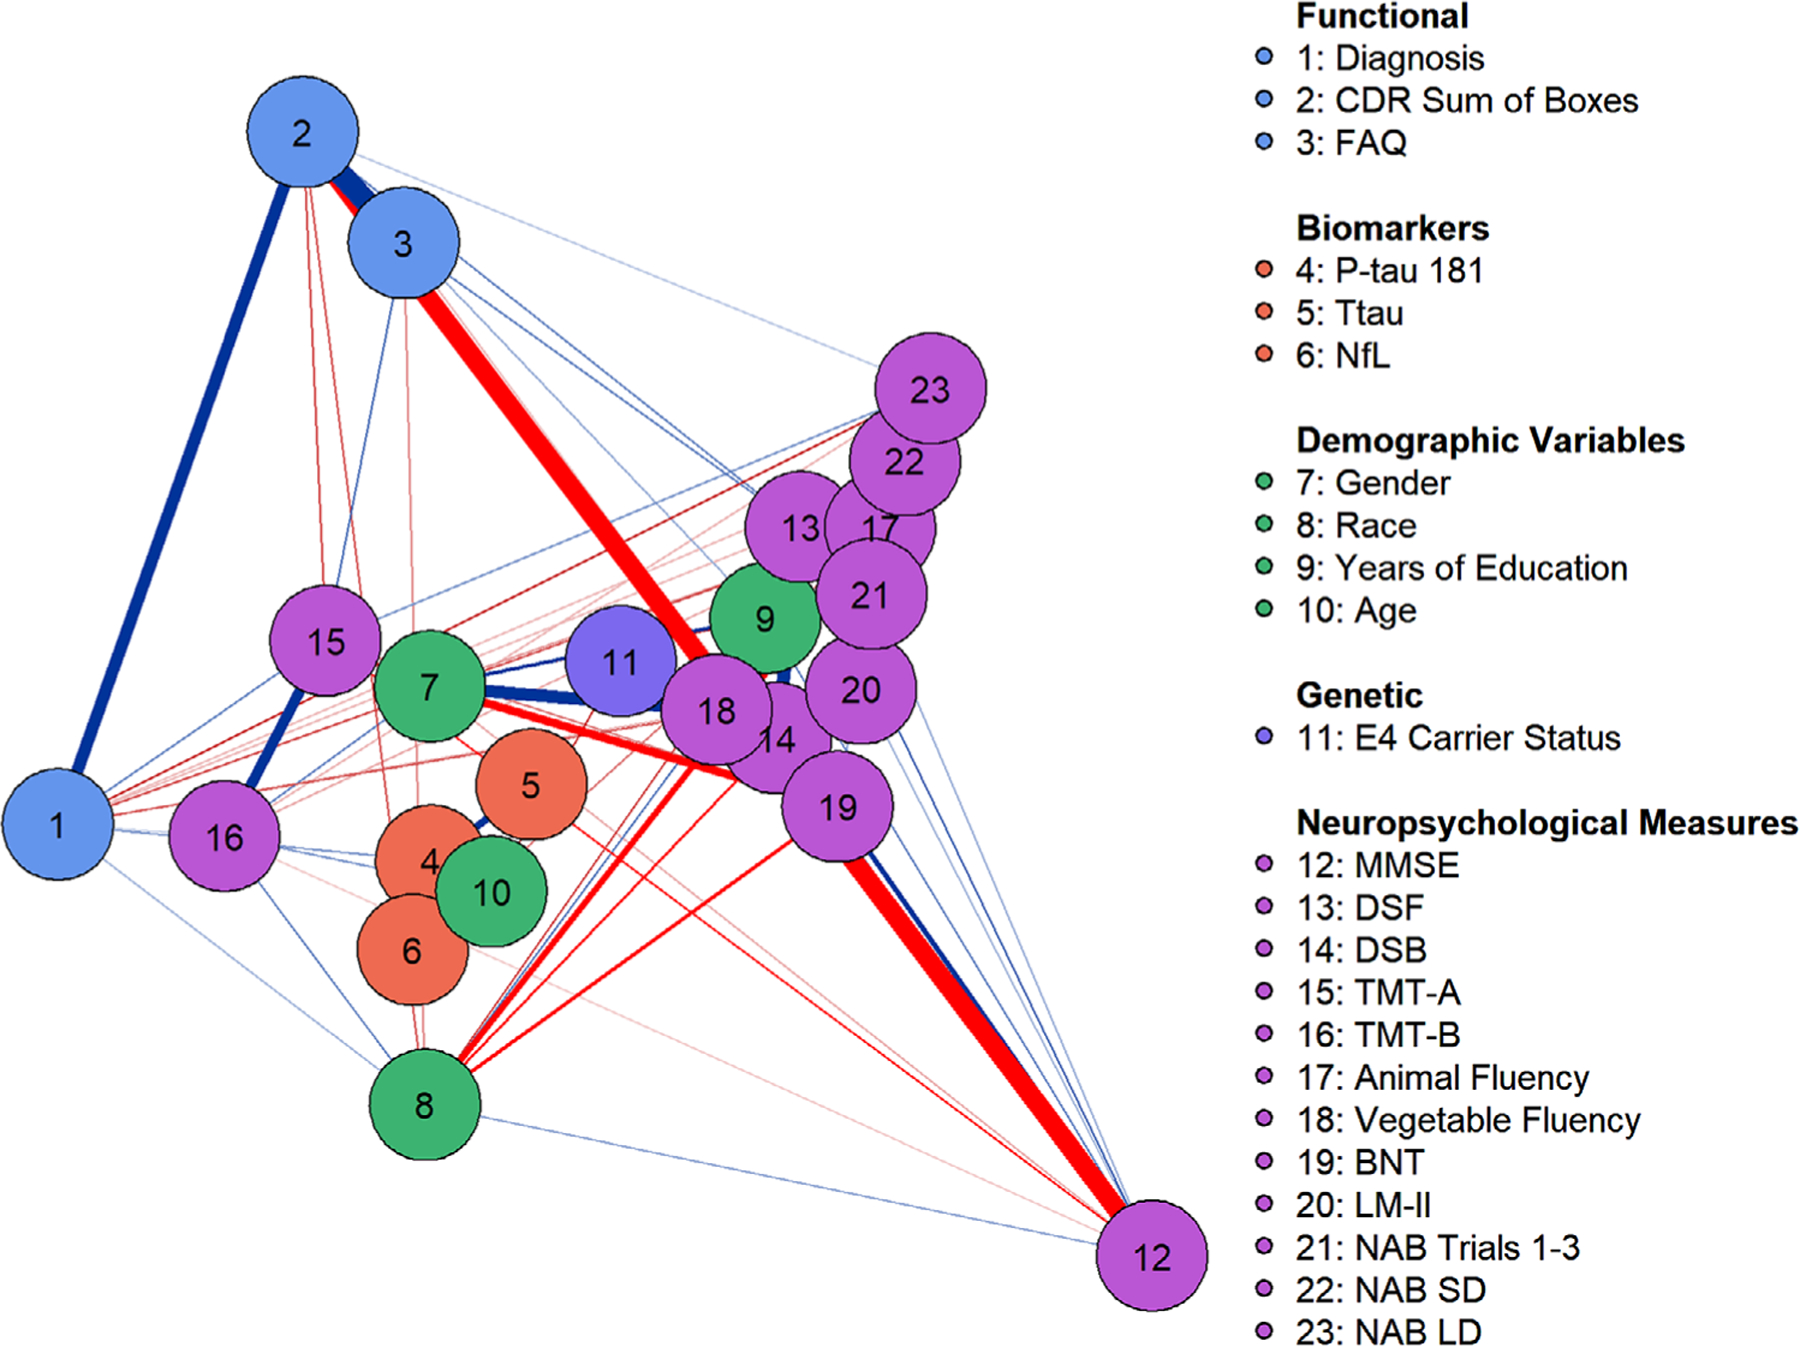
FIGURE 1.

Gaussian graphical model with least absolute shrinkage and selection operator regularization. Latent dimensions were estimated with Markov chain Monte Carlo simulation. Nodes on the right side of the visualization load highly on dimension 1 and nodes toward the top load highly on dimension 2. Node location reflects variable loading on the two latent dimensions. Positive associations are depicted as blue. Edge width reflects the magnitude of association and edge saturation (i.e., darkness) reflects the likelihood of the association. Node colors reflect artificial groupings from the legend. BNT, Boston Naming Test; CDR, Clinical Dementia Rating; DSF & DSB, Digit Span Forward and Backward; FAQ, Functional Activities Questionnaire; LM-II, Logical Memory Delayed Recall; MMSE, Mini-Mental State Examination; NAB SD & LD, Neuropsychological Assessment Battery List Learning Test, Short and Long Delay; NfL, neurofilament light; P-tau181, hyperphosphorylated tau; TMT-A & B, Trail Making Test, Parts A and B; Ttau, total tau
