
FIGURE 2.
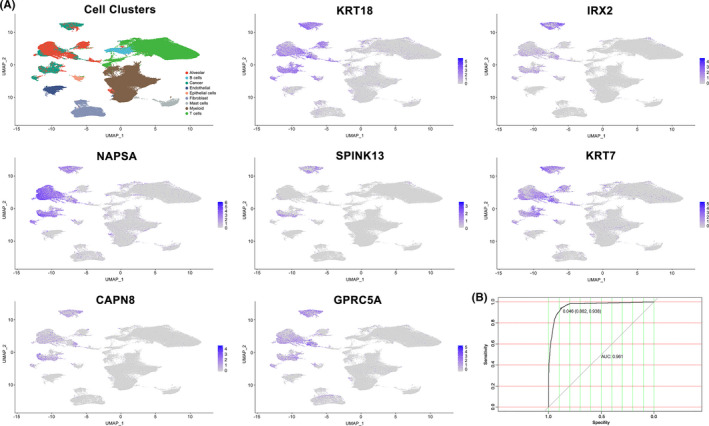
Expression level of the seven genes included in the model and ROC curve of the final model. (A) Expression of genes (KRT18, IRX2, NAPSA, SPINK13, KRT7, CAPN8, and GPRC5A) in every single‐cell type cluster. (B) ROC curve of the final prediction model. Results showed AUC was 0.961 with a sensitivity of 88.2% and a specificity of 93.8%