
FIGURE 3.
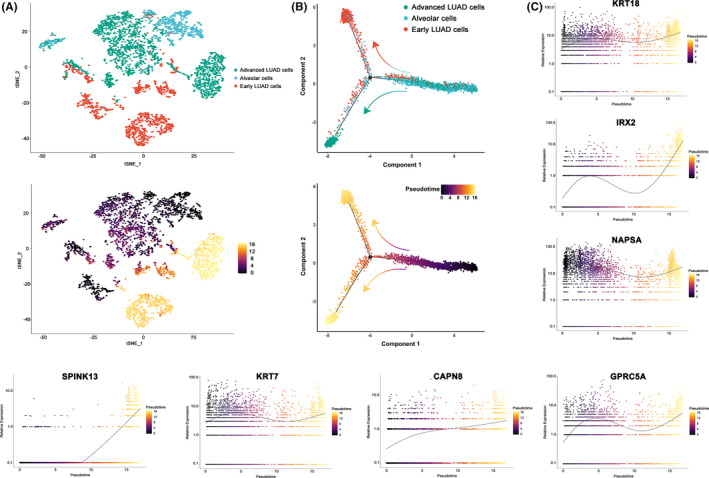
Transcriptional trajectory analysis regarding the seven final genes in tumor and alveolar cells from 17 tumor samples. (A) The transcriptional trajectory of cancer and alveolar cells. TOP: Cells with different colors indicating different cell type clusters identified in Seurat. Bottom: Cells colored by their assigned pseudotime values. (B) Reconstruction of pseudo‐temporal trajectories showing the progression of tumors. TOP: Cells with different colors showing different cell type clusters identified in Seurat. Bottom: Cells colored by their assigned pseudotime values. (C) Jitter plots visualizing expression data for the seven genes changing with pseudotime values