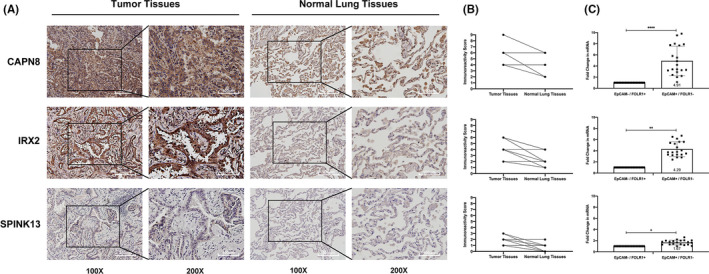
FIGURE 4.

Expression levels of CAPN8, IRX2, and SPINK13 at tissue and cellular levels. (A) Representative images of the 20 LUAD patients showed the elevation of CAPN8, IRX2, SPINK13 expression in tumor samples compared to normal lungs in the same patient analyzed with IHC. (B) IRS scores illustrating the staining intensity of colored cells in each of the 20 IHC images in pairs. N = 20 patients (black dots). (C) Expression of levels of CAPN8, IRX2, and SPINK13 resulting from qRT‐PCR in two groups of sorted cells (EpCAM+/FOLR1– and EpCAM–/FOLR1+ cells) by flow cytometry. Data are shown as the mean ± SD from 20 experiments using samples collected from 20 LUAD patients. *p < 0.05; **p < 0.01; ****p < 0.0001 (Student's t‐test)
