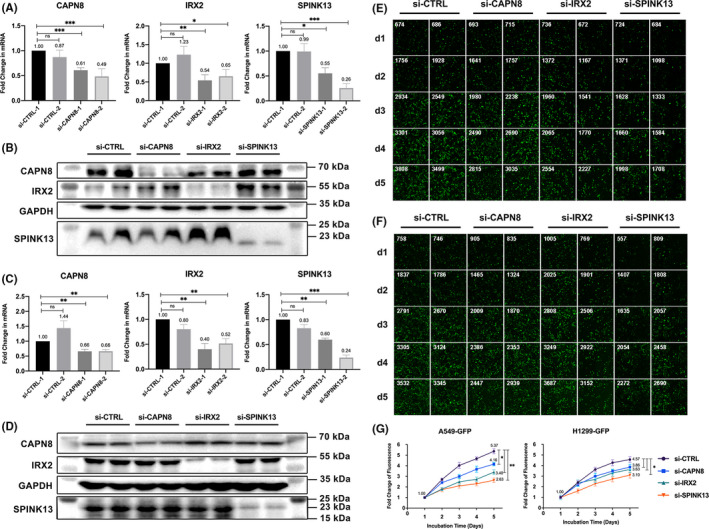
FIGURE 5.

Effects of CAPN8, IRX2, and SPINK13 on cell proliferation in LUAD cell lines. (A) The three genes' expression levels by qRT‐PCR after silencing with different siRNAs in A549 transfected with GFP (A549‐GFP) cells for 24 h. Data are shown as the mean ± SD from three technical replicates (n = 3). (B) Western blot for the three genes in A549‐GFP cells transfected with different siRNAs for 48 h. (C) The three genes' expression levels by qRT‐PCR after silencing with different siRNAs in H1299 transfected with GFP (H1299‐GFP) cells for 24 h. Data are shown as the mean ± SD from three technical replicates (n = 3). (D) Western blot for the three genes in NCI‐H1299‐GFP cells transfected with different siRNAs for 48 h. (E) Fluorescence intensity and numbers of cells in each day after gene silencing in A549‐GFP cells. Data are shown as the mean ± SD from two biological replicates (n = 2). (F) Fluorescence intensity and numbers of cells in each day after gene silencing in NCI‐H1299‐GFP cells. Data are shown as the mean ± SD from two biological replicates (n = 2). (G) Fold changes of fluorescence intensity after gene silencing in A549‐GFP and NCI‐H1299‐GFP cells. Data are shown as the mean ± SD from two biological replicates (n = 2). *p < 0.05; **p < 0.01; ***p < 0.001; ns: Nonsignificance (Student's t‐test)
