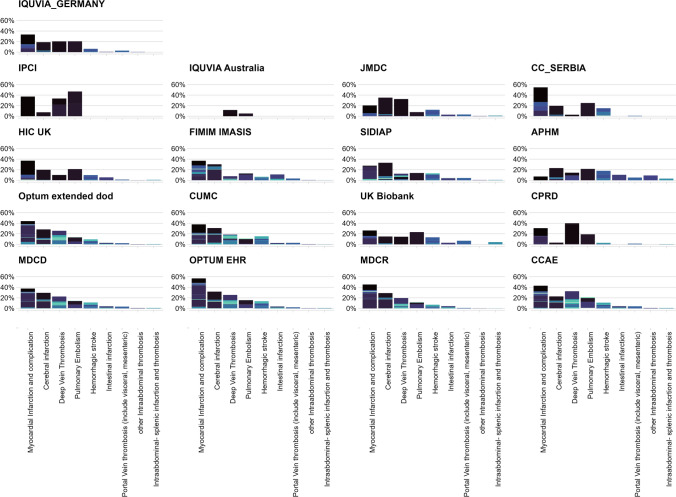
Fig. 4.
The distribution of thrombotic events among thrombosis with thrombocytopenia, defined as patients with a new diagnosis of thrombosis (identified using the narrow set of diagnosis codes) and a new diagnosis of thrombocytopenia (identified either by a diagnosis code or a platelet measurement ≤ 150,000 per microliter) within 7 days, by data source. The thrombotic events are represented by single SNOMED CT concept and grouped by thrombosis subtypes. A single SNOMED CT concept is indicated by specific different color on each histogram, and each histogram represents a specific thrombosis subtype. For example, in Optum_Extended_dod, the color dark purple in the first histogram (myocardial infarction) is the SNOMED CT concept “Acute non-ST segment elevation myocardial infarction.” The length of each bar represents how common one type of thrombosis was compared to the other (for example, myocardial infarction and cerebral infarction are more common than abdominal thrombosis). The diversity of the SNOMED CT concepts (representing diagnosis codes) occurring in each thrombosis type is represented by the variation of colors in each bar. For example, in IPCI and IQVIA_Germany, most thrombosis subtypes are driven by one or two SNOMED CT concept, while in IQVIA_Australia and CUMC, each thrombosis subtype is composed of a diversity of SNOMED CT concepts. CUMC Columbia University Irving Medical Center, IPCI Integrated Primary Care Information, IQVIA_Australia IQVIA® Australia Longitudinal Patient Data, IQVIA_Germany IQVIA® Disease Analyser Germany, Optum_Extended_DoD Optum® De-Identified Clinformatics® Extended Data Mart Database—Date of death, SNOMED CT Systematized Nomenclature of Medicine‐Clinical Terms

