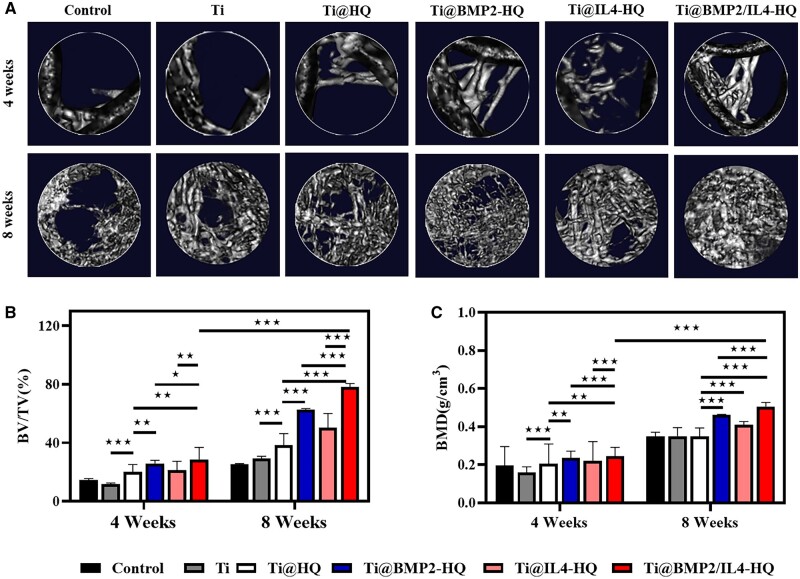
Figure 5.
In vivo bone regeneration analyzed by Micro-CT imaging. (A) Representative Micro-CT images captured at 4- and 8-weeks post scaffold implantation. The untreated bone defect served as the control group. (B and C) Quantitative analysis of bone volume (B) and bone density (C) within the bone defect area. Data are shown as mean ± SDs (n = 8). *P < 0.05, **P < 0.01 and ***P < 0.001, between the indicated groups

