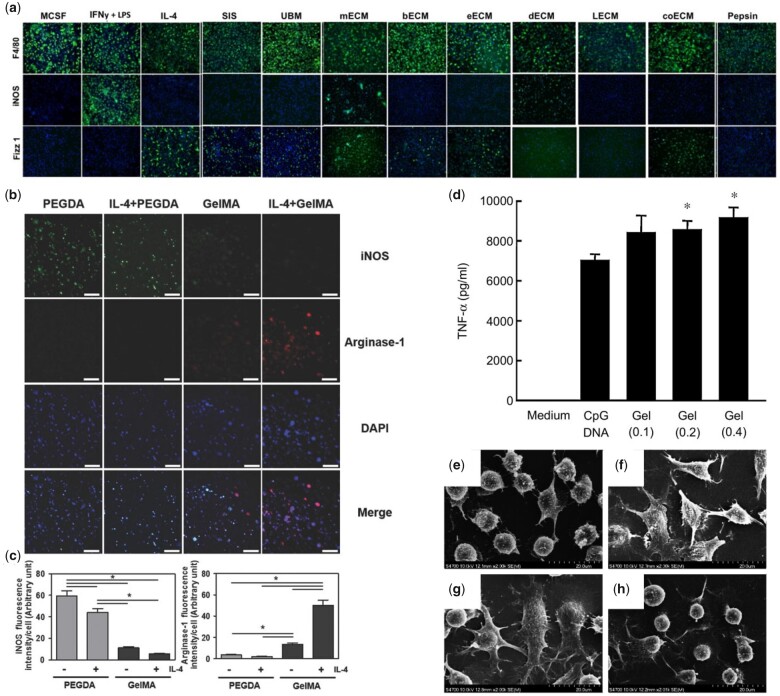
Figure 8.
Molecular presentation of hydrogels regulates immune cell response. (a) Immunofluorescence of different ECM treated macrophage for M1 and M2 phenotype (iNOS and Fizz1, respectively). F4/80 was used as a pan macrophage marker. Adapted with permission from Ref. [148]. (b) Immunofluorescence of macrophage encapsulated in PEGDA and GelMA hydrogels in the absence or presence of IL-4 for M1 and M2 phenotype (iNOS and arginase-1, respectively). (c) Quantitative analysis of (b). Adapted with permission from Ref. [21]. (d) TNF-α production from RAW264.7 cells after addition of CpG X-DNA (CpG DNA) or CpG DNA hydrogels. (e–h) SEM images of DC2.4 cells before (e) and after addition of LPS (f), CpG DNA hydrogels (g), or CpG-free DNA hydrogels (h). Adapted with permission from Ref. [161].

