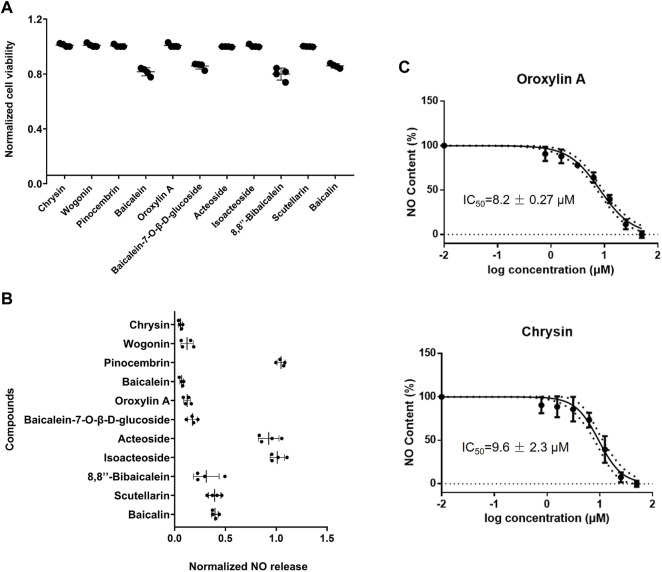
FIGURE 3.
Verification and screening of anti-inflammatory activity of active components in Raw264.7 cells. (A) Viability of Raw264.7 cells. Cells were treated with 50 μM corresponding reagents and then measured by MTT assay, following by the normalization of cell viability. (B) Screening results in Raw264.7 cells. Cells were treated with 1 µg/ml LPS and 50 μM corresponding reagents, and then measured the release of NO, followed by the normalization of inhibition rate. (C) Dose-dependent inhibitory response of LPS-induced NO release in Raw264.7 cells. Cells were treated with 1 µg/ml LPS and serial concentration of chrysin and oroxylin A (0.78, 1.56, 3.12, 6.25, 12.5, 25, and 50 μM) and then measured the release of NO, followed by the normalization of inhibition rate. All data were reported as the mean of three independent experiments.

