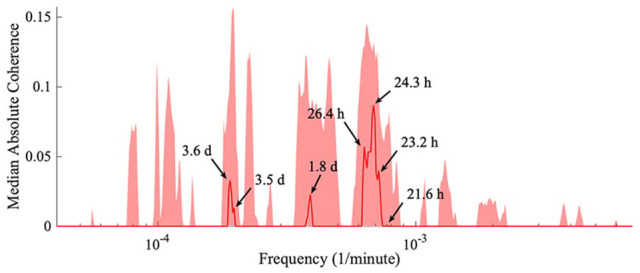
Figure 10.

The median absolute coherence. After obtaining the wavelet phase coherence results for each pair of mice, the average phase coherence is calculated. The surrogate values were subtracted, and the median (red line) and 90th percentile (shaded red area) were determined across all the pairs of mice. Significant peaks correspond to an external driver synchronizing all the mice. Four frequency clusters arise, with peaks within a cluster possibly due to time variation.
