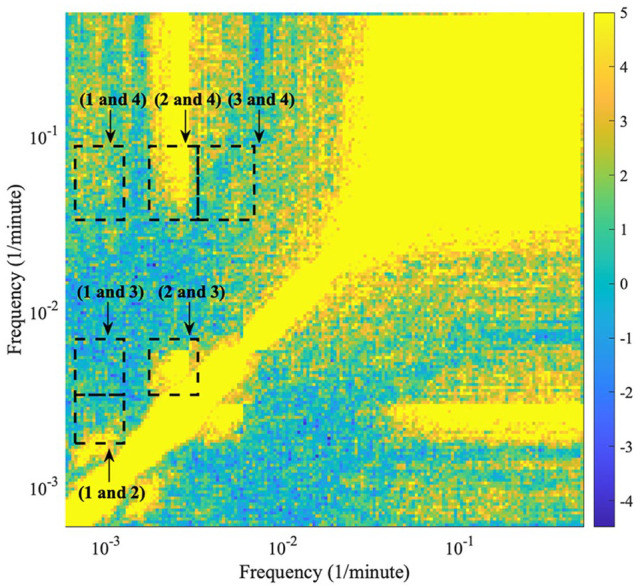
Figure 7.

The detected harmonics within the behavioral data of mouse 2. The plot is a frequency-frequency representation showing what oscillations are in harmonic relationships. The image is symmetric over the diagonal; therefore, only half of the figure is considered. The frequency boundaries used during ridge extraction for each oscillation detected in the time-frequency representation (oscillation 1, 2, 3, and 4) form the outlines of the dashed boxes in the figure. All the different combinations of frequencies are investigated, and the boxes are plotted over the harmonic results. The color code shows a dimensionless quantity obtained from the actual value, minus the mean of the surrogate distribution, divided by the standard deviation of the surrogate distribution. Negative values correspond to results with values lower than the surrogate mean; therefore, significant results are those above 0. For oscillation combinations which overlap with higher valued areas, the two frequencies are more likely in a harmonic relationship.
