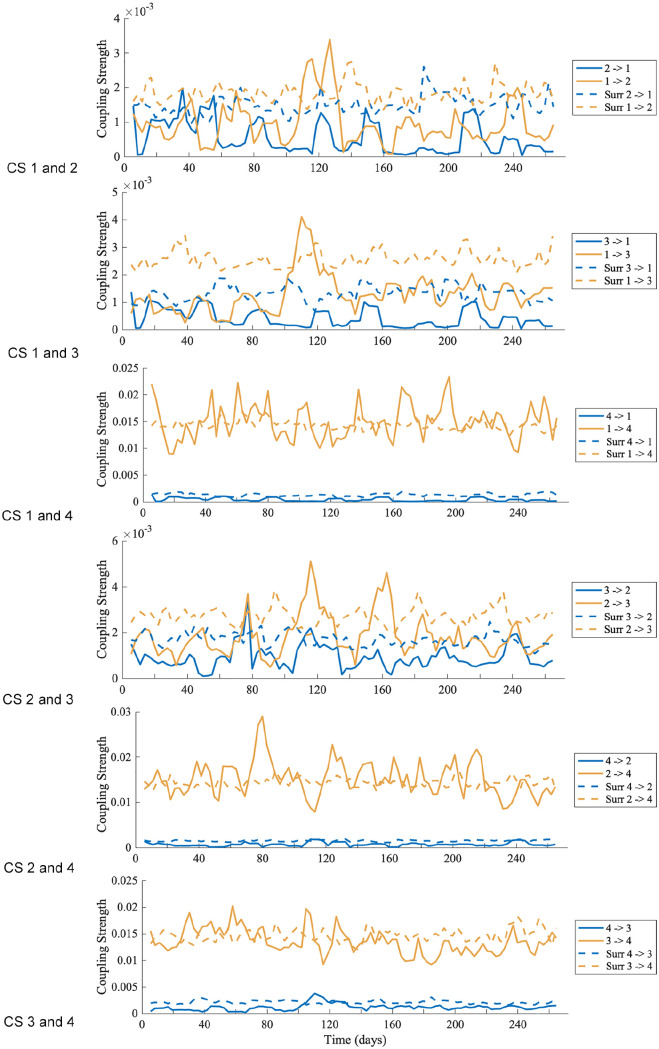
Figure 8.
The coupling strength over time between four oscillations (oscillation 1, 2, 3, and 4), within the behavioral data of mouse 2. The solid lines denote the coupling strength results over time, obtained from dynamical Bayesian inference. The dotted lines are the surrogate significance tests. Only results above the surrogate lines are significant. The arrow in the legend denotes the direction of coupling.

