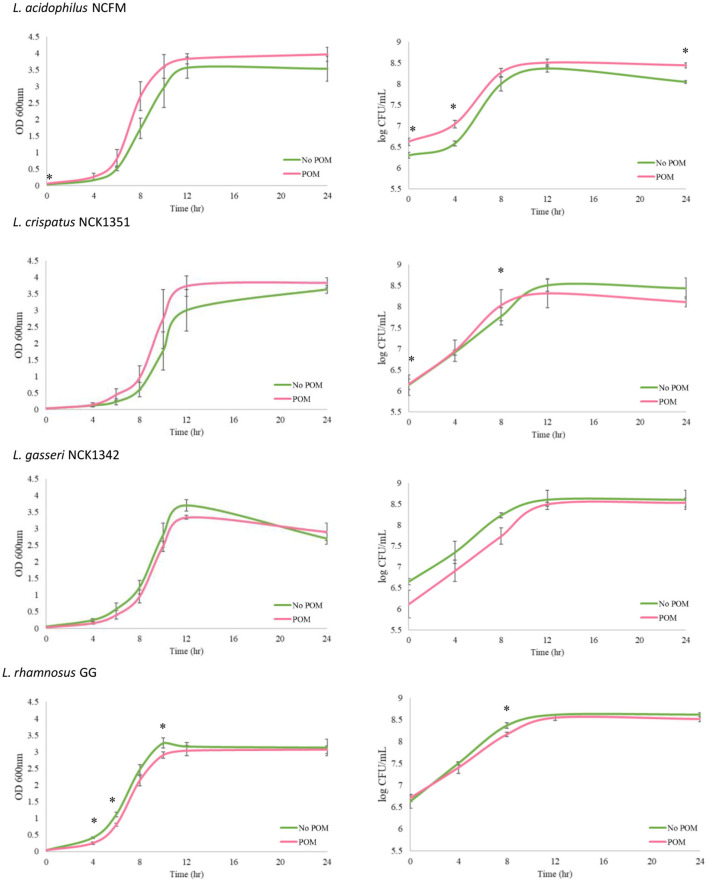
Figure 1.
Growth of Lactobacillus strains with and without the POM extract (400 μg/ml). Growth assays were performed over a 24-h period with the L. acidophilus NCFM, L. crispatus NCK1351, L. gasseri NCK1342, and L. rhamnosus GG grown in SDM with 0.5% glucose and no POM extract (green curve, No POM) or in SDM with 0.5% glucose and 400 μg/ml of POM extract (red curve, POM). Graphs on the left-hand side show OD 600 nm values, and log CFU/ml growth curves are shown on the right-hand side. Error bars represent the standard deviation of three biological replicates, and * indicates p ≤ 0.05.

